
Cost Variance in Construction: The EVM Metric Explained
Understand construction cost variance to manage your budget effectively. Learn how to calculate and analyze it for successful projects.

Construction cost variance (CV) is the difference between what a piece of work was budgeted to cost and what it actually cost, calculated as CV = BCWP - ACWP, where BCWP is the Budgeted Cost for Work Performed and ACWP is the Actual Cost of Work Performed. A positive result means the work came in under budget. A negative result means you’re paying more than planned, and that gap only grows if nobody catches it early.
You can run this calculation two ways: as a period figure covering a single reporting window (this week, this pay period) or as a cumulative figure tracking the project from day one to today. Period CV tells you what just happened. Cumulative CV tells you where the whole job stands, and it’s the number that should keep a project executive up at night.
Quick reference: The Defense Acquisition University’s earned value framework treats CV as a standard performance metric, not a construction-specific invention. That matters, because the same math you’d use on a federal contract works identically on a $2 million tenant buildout.
- Favorable CV (positive number): You’ve spent less than the value of work completed. Good news, but verify it isn’t due to unbilled work or a lagging cost entry.
- Unfavorable CV (negative number): You’ve spent more than the work is worth. This is the number that erodes margin fastest on thin-margin subcontract work.
- Period vs. cumulative: Use period CV to catch a bad week before it becomes a bad month; use cumulative CV to report overall project health to ownership.
Key Takeaways
Cost variance works as an early warning system only when BCWP and ACWP come from clean, matched, real-time data rather than month-end reconciliation.
| Point | Details |
|---|---|
| Formula and interpretation | CV = BCWP - ACWP; negative means over budget, positive means under, and cumulative CV matters more than any single period. |
| Isolate the driver | Split variance into price (rate) and volume (efficiency) components before deciding on a corrective action. |
| Set thresholds before you need them | Escalate at roughly 5% per cost code or 3% cumulative, tighter on thin-margin jobs. |
| Watch CV alongside CPI and SV | Schedule variance often moves first; cost variance frequently lags it by weeks. |
| Won2build closes the reporting gap | CO Hub, Time Budge, Bid Track, and Takeoff feed real-time, cost-coded data into one system to reduce variance lag. |
Table of Contents
- What Is Construction Cost Variance and Why Track It Weekly?
- How Do You Calculate Cost Variance Step by Step?
- A Worked Example: Reading a Real Cost Variance Number
- How Does Cost Variance Relate to Schedule Variance and CPI?
- What Actually Drives Cost Variance on a Construction Job?
- When Should a Cost Variance Trigger Action?
- How Often Should You Report Cost Variance to Stakeholders?
- What Data Sources Do You Need to Track Cost Variance Accurately?
- A Practical Checklist for Reducing Future Cost Variance
- Close Cost Variances Faster With Integrated Job Cost Tools
- Frequently Asked Questions
- Sources
What Is Construction Cost Variance and Why Track It Weekly?
Cost variance isn’t an accounting abstraction. It’s the earliest warning system most subcontractors have for a job going sideways, and it works because it separates two numbers that intuition tends to blend together: how much work actually got done, and how much cash actually went out the door.
That distinction is the entire point of earned value management (EVM). A crew can burn through payroll hours without finishing proportional work, and a simple “budget vs. actual spend” comparison won’t catch that. BCWP fixes this by asking a sharper question: based on the percentage of work physically completed, what should this have cost? Compare that to ACWP, the real dollars spent, and CV tells you the truth.
Construction cost analysis built around CV also plugs directly into schedule performance, contract type, and contingency planning. It’s the connective tissue between field production and the finance office, which is why most experienced controllers check it before anything else on a project dashboard.
How Do You Calculate Cost Variance Step by Step?
Getting a clean CV number depends entirely on the quality of two inputs: BCWP and ACWP. Garbage in, garbage out applies here more than almost anywhere else in construction accounting.
Required inputs:
- Percent complete by cost code (from field reports, foreman sign-offs, or a takeoff-based progress measurement)
- The original budgeted cost per cost code
- Actual costs posted to date (labor, materials, subcontracts, equipment)
- Committed costs (purchase orders and subcontracts issued but not yet fully invoiced)
The procedure:
- Pull percent complete by cost code from field data, not from a project manager’s gut estimate.
- Multiply percent complete by the original budget for that code to get BCWP.
- Pull actual costs to date for the same code from your accounting system or job cost ledger.
- Calculate ACWP as total actual costs posted against that code.
- Apply CV = BCWP - ACWP for the period, then repeat cumulatively from project start.
- Cross-check against committed costs to catch problems before they’re even posted.
Two things wreck this calculation more than anything else: mismatched cost code structures between the field and the office, and change orders sitting in a folder somewhere instead of posted to the job. If your estimating cost codes don’t match your field timekeeping codes, BCWP and ACWP are comparing apples to invoices.
Pro Tip: Run CV using committed costs, not just posted actuals, for a two-to-three-week head start on bad news. Actual costs lag reality because invoices take time to process; committed costs (issued POs and signed subcontracts) show you the exposure the moment it exists.
A Worked Example: Reading a Real Cost Variance Number
Say you’re tracking drywall installation on a $500,000 subcontract.
| Metric | Value |
|---|---|
| Budgeted cost for the code | $500,000 |
| Percent complete | percentage complete by cost code |
| BCWP (0.60 x $500,000) | $48,000 |
| ACWP (actual costs posted) | $58,000 |
| Period CV (BCWP - ACWP) | -$10,000 |
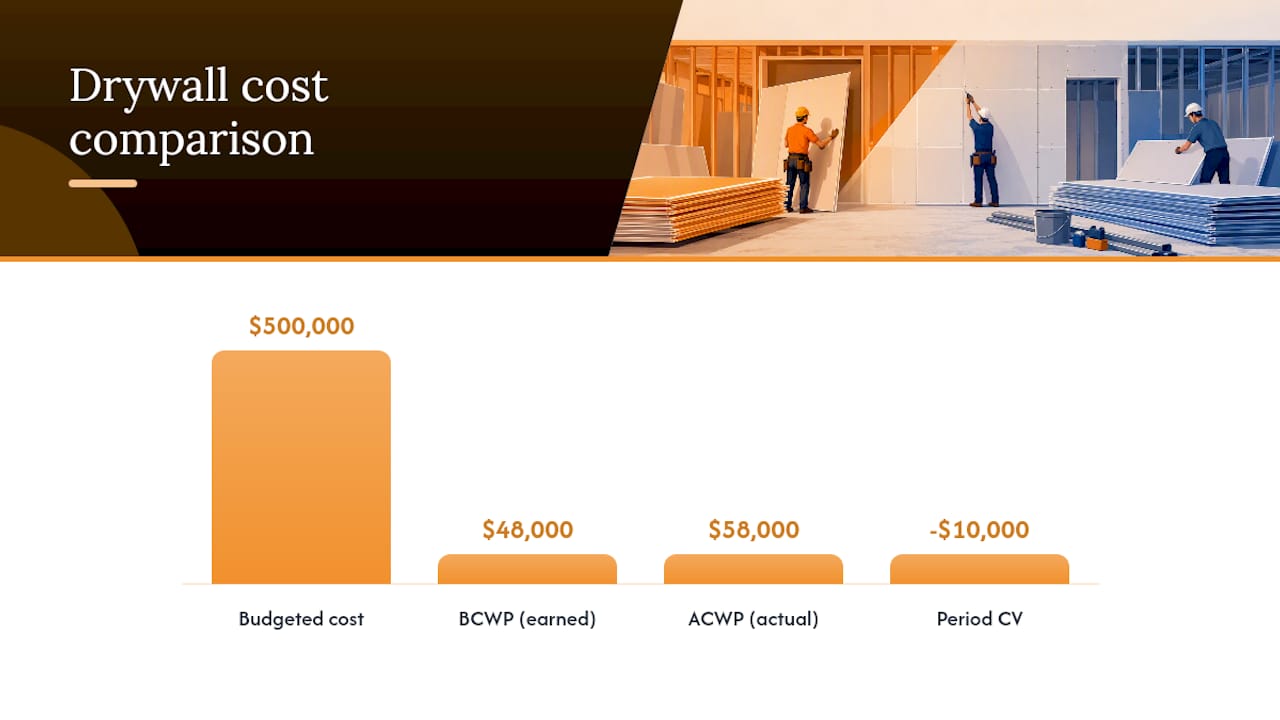
That negative $10,000 means the work performed is worth $48,000, but it actually cost $58,000 to get there. In plain language: you’re $10,000 over budget on this code alone, right now, this period.
That’s the number that should trigger a conversation with ownership, because an unfavorable variance showing up this early in a project frequently signals a larger overrun by completion, not a one-time blip that self-corrects.
How Does Cost Variance Relate to Schedule Variance and CPI?
CV rarely tells the whole story alone. Pair it with the Cost Performance Index (CPI), calculated as BCWP divided by ACWP, and you get a ratio instead of a dollar amount. A CPI below 1.0 confirms the same unfavorable signal as a negative CV, and it’s more useful for comparing performance across cost codes of very different sizes.
Schedule variance (SV), calculated as BCWP minus Budgeted Cost of Work Scheduled (BCWS), measures timing rather than cost. Here’s the pattern worth watching: cost variance often lags schedule variance. A crew can fall behind schedule for weeks before that delay shows up as an unfavorable cost number, because overtime, expedited materials, and rework costs take time to post to the ledger.
Metrics to track alongside CV:
- CPI — efficiency ratio, useful for comparing performance across dissimilar cost codes
- SV — timing gap, often the earliest signal something’s wrong
- Estimate at Completion (EAC) — forecasted total cost based on current performance trends
- Variance at Completion (VAC) — the gap between original budget and EAC, your bottom-line risk number
A common early-warning pattern: SV turns negative first (the crew is behind), CV stays roughly neutral for a few weeks (the office hasn’t caught up on billing), and then CV turns sharply negative once overtime and expediting costs hit the books. If you’re only watching CV, you’re watching the metric that tells you last.
What Actually Drives Cost Variance on a Construction Job?
Most unfavorable variances trace back to a short list of repeat offenders, and job cost variance analysis consistently points to roughly 80% of dollar impact coming from about 20% of cost codes on a given project. Chasing every small variance wastes time; chasing the top five or six codes usually finds the real problem.
Common causes:
- Labor productivity shortfalls (crews taking longer than estimated to complete a unit of work)
- Material price increases between estimate and purchase
- Waste, theft, or damaged material requiring reorders
- Extended equipment rental due to schedule slippage
- Unapproved or unbilled subcontractor change orders
- Estimating errors baked in before the job even started
Isolating the cause requires splitting total variance into price (rate) variance and volume (efficiency) variance. Standard cost accounting frames this split clearly: price variance measures whether you paid more or less per unit than budgeted (lumber costing $8 a board foot instead of the estimated $6.50), while volume variance measures whether you used more or fewer units than planned (needing 12,000 board feet instead of 10,000 due to rework).
Diagnostic steps:
- Run cost-code-level analysis to find the top three to five variance drivers.
- Reconcile actual quantities used against estimated quantities to isolate volume variance.
- Compare current material and labor rates against estimated rates to isolate price variance.
- Break down variance by trade or subcontract to identify which relationships need scrutiny.
- Compare committed costs against actuals to catch exposure that hasn’t posted yet.
When Should a Cost Variance Trigger Action?
Not every variance needs a fire drill. A well-run cost control process sets thresholds before the job starts, not after the number looks scary.
Tighter margins call for tighter thresholds; a job running on a 3% net margin can’t absorb the same variance tolerance as one running on 12%.
Escalation flow once a threshold trips:
- Analyze the offending cost code in isolation before assuming a project-wide problem.
- Confirm data integrity: check for miscoded entries, duplicate invoices, or unposted change orders.
- Isolate the root cause using the price/volume breakdown above.
- Apply a corrective action matched to the cause.
- Update the EAC and draw down contingency if the variance is real and unrecoverable.
Mitigation tactics, ranked roughly by speed of impact:
- Re-sequencing work to reduce idle crew time (fast, low cost)
- Approved change orders to recover scope-driven cost (moderate speed, depends on owner turnaround)
- Alternative suppliers for price-driven material variances (moderate speed)
- Overtime or added crews to recover schedule-driven cost creep (fast, but expensive and can mask the real problem)
- Contract remedies or claims for owner-caused delays (slow, but sometimes the only recovery path)
Pro Tip: Separate your short-term fixes from your medium-term contractual remedies in the same tracking sheet. A crew re-sequence you can do today; a change order claim might take six weeks. Treating them as the same category of action is how corrective plans stall out.
How Often Should You Report Cost Variance to Stakeholders?
Weekly CV reporting at the field level catches problems while they’re still cheap to fix. Monthly or biweekly summary reporting to executives and ownership works for the cumulative, big-picture number, since that audience needs trend direction more than granular weekly noise.
Pair CV with a short set of KPIs in every report: CPI, SV, EAC, percent complete by cost code, committed versus actual spend, and the current change-order backlog. A report showing CV alone, without CPI or SV for context, tells only half the story.
| Reporting layer | Cadence | Primary audience |
|---|---|---|
| Cost-code level CV | Weekly | Project manager, superintendent |
| Cumulative CV and CPI trend | Biweekly | Project executive, controller |
| EAC and VAC summary | Monthly | Ownership, senior leadership |
For visualization, a trend line of cumulative CV over time catches drift long before a single bad week would. A waterfall chart breaking out the top five cost-code drivers turns a vague “we’re over budget” into a specific, actionable conversation. Governance matters too: someone needs to own the CV number, someone needs authority to approve corrective change orders, and that path needs to be defined before the first bad report shows up, not during it.
What Data Sources Do You Need to Track Cost Variance Accurately?
Accurate CV depends on five data streams working together, and most of the errors in variance reporting trace back to one of these being late, incomplete, or coded inconsistently.
- Cost-coded time entries from the field, tied to the same code structure as the original estimate
- Posted vendor and subcontractor invoices, reconciled against purchase orders
- Committed cost files (open POs, signed subcontracts) for early exposure visibility
- Percent-complete inputs verified against physical progress, not just crew self-reporting
- Change-order logs updated in real time, not batched at month-end
Integrated field-to-office software closes the gap between when a cost happens and when someone in the office sees it. That single-source-of-truth approach removes the double entry that causes cost codes to drift apart between the field system and the accounting system, and it automates the BCWP calculation instead of relying on a spreadsheet someone updates when they remember.
As a practical example: change-order tracking tools like Won2build’s CO Hub keep unbilled change work visible the moment it’s approved, rather than sitting in a folder until month-end. Labor tracking tools like Time Budge feed cost-coded hours directly into the same system driving BCWP calculations, and estimating tools like Bid Track and digital takeoff platforms improve the accuracy of the original budget those variances get measured against.

Pro Tip: When evaluating any cost tracking tool, confirm it syncs with field data in real time and produces cost-code-level earned value output automatically. A tool that requires manual re-entry to calculate BCWP defeats the purpose of tracking variance at all.
A Practical Checklist for Reducing Future Cost Variance
Once you’ve spotted a variance, work through this in order:
- Reconcile cost codes between field and office systems — mismatched codes make every downstream number unreliable.
- Confirm percent complete with a physical walk or photo verification, not just a foreman’s estimate.
- Validate change orders are posted and priced correctly before they distort the actual cost figure.
- Update commitments to reflect current pricing on open purchase orders and subcontracts.
- Reforecast EAC using the latest CPI trend rather than the original budget assumption.
- Adjust contingency draw proportional to the confirmed, root-caused variance, not a guess.
Each step exists to remove a specific source of noise from your CV number, so by the time you act on it, you’re acting on reality instead of a data artifact.
A cost controller’s take on the variance trap
The most common mistake I see isn’t a calculation error. It’s accepting a percent-complete number from the field without questioning it, because a crew under pressure will round up progress just enough to keep the earned value number looking healthy. That single habit quietly erases weeks of early warning that CV is supposed to provide.
My practical tip: spot-check percent complete against physical measurements at least once per reporting cycle, especially on cost codes with historically volatile productivity. It takes twenty minutes and it protects the integrity of every number downstream of it. For more detailed procedures on setting up that verification process, a structured budget tracking setup guide walks through the field-to-office workflow in more depth.
Close Cost Variances Faster With Integrated Job Cost Tools
Won2build built its four core applications around the exact data gaps that make cost variance hard to catch in time. CO Hub logs and prices change orders the moment they happen instead of letting them sit unbilled for weeks, which is one of the most common causes of unfavorable CV showing up late. Time Budge pushes cost-coded labor hours straight into your job cost picture without a second data entry step, and Bid Track and Takeoff improve the accuracy of the original estimate your variance gets measured against in the first place.
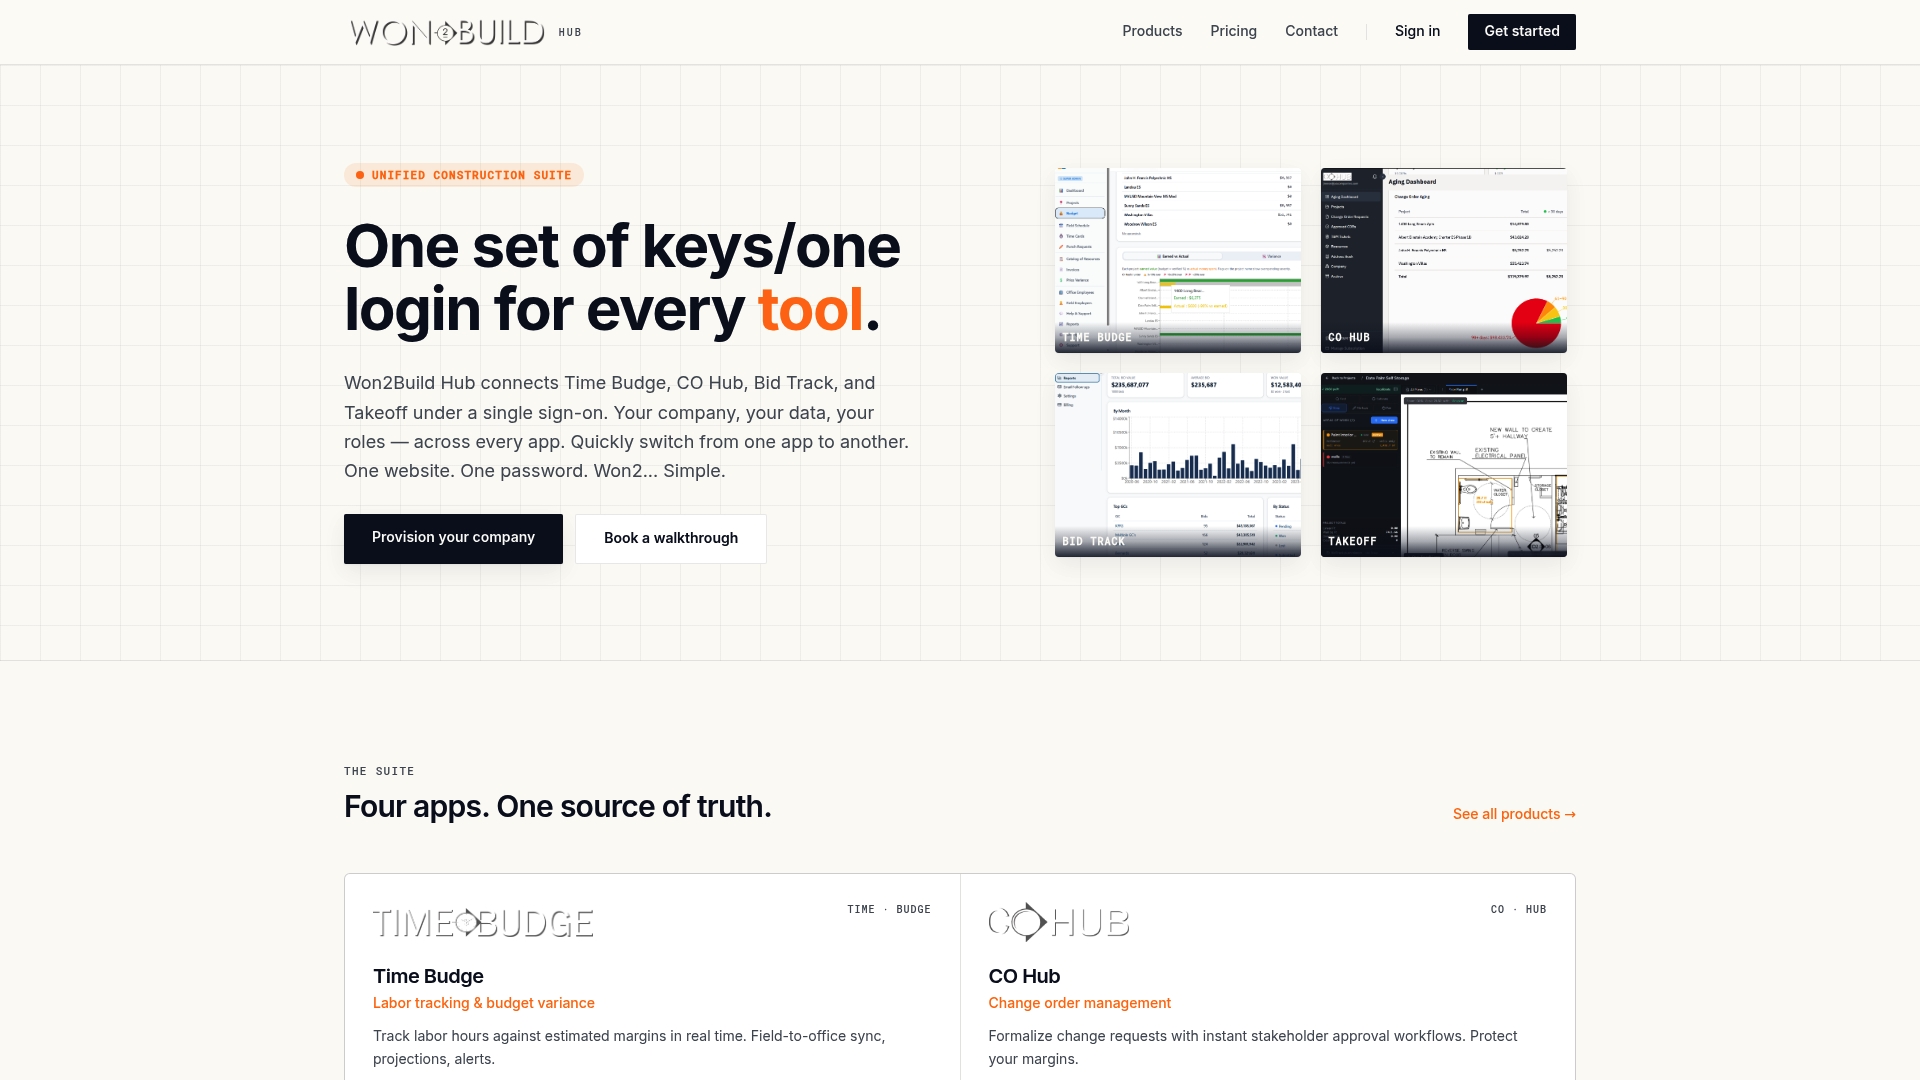
Because all four run through a single login with real-time field-to-office sync, you’re comparing BCWP and ACWP against numbers that were entered once, not reconciled from three different spreadsheets after the fact. That’s the difference between catching a $10,000 variance in week two and discovering it in month three when the contingency is already gone.
If unbilled change orders are your biggest source of variance right now, start with CO Hub’s change order management tools and see how it tracks against your current process.
Frequently Asked Questions
What is construction cost variance in simple terms? It’s the dollar difference between the value of work actually completed and what it cost to complete it, calculated as BCWP minus ACWP. A negative number means you’re spending more than the work is worth.
Is a positive or negative cost variance better? Positive is favorable, meaning the work cost less than budgeted for the progress achieved. Negative is unfavorable and signals an overrun that tends to compound if left unaddressed.
How is cost variance different from schedule variance? Cost variance measures money against work performed; schedule variance measures work performed against work planned. Schedule problems often show up before cost problems do, since cost impacts take time to post.
How often should cost variance be calculated on an active job? Weekly at the cost-code level for field teams, with a cumulative summary reviewed biweekly or monthly by project executives and ownership.
Does contract type affect how you interpret cost variance? Yes. On a lump sum contract, unfavorable CV comes straight out of your margin. On cost-plus work, it may be recoverable depending on contract terms, and on unit price contracts, volume variance often matters more than price variance.
Sources
- Cost Variance (CV)
- Job Cost Variance Analysis: How to Investigate Why Projects Go Over Budget
- What is the cost variance formula?
Recommended
One login for estimating, bid tracking, change orders, and labor.
The Hub is free. Pay only for the apps you turn on.
Create your free Hub account- 7 Concrete Takeoff Steps Estimators Use to Avoid Ordering ShortfallsFollow seven concrete takeoff steps to calculate cubic yards, size rebar and formwork, convert volumes to supplier units, and verify quantities before bid...
- Are E-Signature Change Orders Legal and Worth the Switch?E-signature change orders streamline your workflow, ensuring faster approvals, fewer disputes, and quicker invoicing—discover the benefits now!
- How to Link Takeoff to Estimate for Accurate BidsLink your takeoff quantities to your estimate for accurate bids. Discover the seamless integration method that reduces errors and saves time.