
3 Bid Pipeline Metrics Proposal Managers and Subcontractors Should Track
Learn the three bid pipeline metrics that matter: proposal stage win rate, pipeline coverage, proposal cost per win. Formulas and fixes.

The three metrics worth tracking first are proposal-stage win rate, pipeline coverage ratio, and proposal cost per win. Before anything else, pick one denominator, we recommend “proposals sent,” and apply it consistently across every report. Start a rolling report over a period of months this week. The sections below walk through the formulas, benchmark ranges, and specific changes that move these numbers.
TL;DR:
- Teams should focus on proposal sent as the denominator to ensure consistent and accurate reporting across all bid metrics.
- A pipeline coverage ratio of at least 3x the revenue target is recommended, with higher ratios needed for teams with lower win rates.
- Shortening review cycles and implementing qualification checklists significantly improve proposal velocity and win rates.
- Segmenting metrics by project size, customer type, and sector reveals hidden performance issues and guides targeted improvement efforts.
- Maintaining clean, standardized pipeline data prevents inflated win rates and ensures reliable tracking of progress and process health.
Table of Contents
- Key metrics every bid pipeline should track
- How to calculate each metric without fooling yourself
- What’s a good win rate, and how to diagnose a bad one
- Levers that actually move your numbers
- Where to pull reliable pipeline data
- A subcontractor’s view of pipeline priorities
- What bid pipeline metrics are and why they matter
- How market conditions and competition change your benchmarks
- How team skills and roles show up in the numbers
- Segmenting your metrics by project size, customer, and sector
- Where bid metrics data quality breaks down
- Putting the analysis to work: three examples
- Why selectivity usually beats volume
- How Won2Build helps you track and improve these numbers
- FAQ
- Sources
Key metrics every bid pipeline should track
Not every metric deserves equal attention. Each one answers a different question, and mixing them up is how teams end up arguing about numbers that do not mean what they think.
Win rate comes in three useful flavors. Pipeline-stage win rate (wins divided by all opportunities entered) tells you how good your targeting is. Proposal-stage win rate (wins divided by proposals actually submitted) tells you how good your proposals are. Revenue-weighted win rate (won dollar value divided by total bid dollar value) tells you whether you win the deals that matter financially, not just the easy small ones.
Pipeline coverage ratio compares open pipeline value to your revenue target for the period. If your target is $2 million and your open pipeline sits at $6 million, your coverage ratio is 3x. Most teams aim for a coverage multiple based on their historical win rate: a lower win rate needs a higher multiple to hit the same revenue goal.
Advancement rate and its inverse, late-stage no-bid frequency, flag qualification problems before they become wasted proposal hours. If opportunities keep dying after shortlisting, something in your qualification criteria is loose.
Proposal cost and proposal cost per win capture the labor, consultants, and overhead spent chasing work, divided across wins to show what a contract actually costs to land.
Time-to-first-review and time-to-close are velocity metrics: slow internal review on a proposal is one of the most common, and most fixable, causes of a lost bid.
- Win rate variants separate targeting quality from proposal quality.
- Pipeline coverage tells you whether you have enough live opportunities to hit target.
- Advancement rate and proposal cost per win expose where effort is wasted.
A quality score, built from reviewer checklists or client feedback, rounds out the picture by flagging proposals that look fine on paper but miss the mark on content.
How to calculate each metric without fooling yourself
Formulas are simple. The discipline is in the denominator.
- Total win rate = wins ÷ total opportunities entered into the pipeline. If you logged 40 opportunities and won 8, your total win rate is 20%.
- Proposal-stage win rate = wins ÷ proposals actually submitted. If only 20 of those 40 opportunities reached a submitted proposal and you won 8, your proposal-stage win rate is 40%, double the first number for the same 8 wins.
- Revenue-weighted win rate = won contract value ÷ total bid value. Ten $100,000 wins out of $2,000,000 in total bid value is 50%, even if your count-based win rate looks worse.
The denominator decision matters more than the formula. Decide upfront what counts as an “opportunity” (a qualified lead with a defined scope and budget signal, not every inbound inquiry) and what counts as a “proposal” (a document actually submitted, not a draft). Strip out phantom records: duplicate entries, opportunities with no activity in 90 days, and anything marked “pursuing” for more than two review cycles without movement.
Report on rolling windows rather than calendar months alone. A 30-day window shows short-term swings and catches process breakdowns fast. A 90-day window smooths out lumpy bid cycles and is the best default for a working dashboard. A 365-day window is for trend analysis and year-over-year comparisons, not day-to-day management.

What’s a good win rate, and how to diagnose a bad one
Benchmarks only mean something once you know which tier you are measuring. Proposal-stage win rate, wins divided only by submitted proposals, tends to land in a higher range than other measurement tiers because it excludes everything that never advanced far enough to get a proposal. Qualified-pipeline win rate, which includes vetted opportunities that never reached submission, typically runs lower, and all-opportunities win rate (every lead, qualified or not) is lower still.
Benchmarks vary widely by measurement tier and by deal size, so align your denominator before comparing your numbers to anyone else’s. Larger, longer-cycle contracts generally carry lower win rates and longer time-to-close than small, fast-turnaround work, which is normal and not a red flag on its own.
When a win rate looks low, run through this checklist before assuming your team is underperforming:
- Denominator mismatch: are you comparing your proposal-stage rate to someone else’s all-opportunities rate?
- Stale deals: do opportunities sit untouched for months, inflating your pipeline count without ever converting?
- Low proposal quality: do reviewer scores or client feedback point to weak content rather than weak targeting?
- High proposal cost: are you spending heavily on bids that rarely convert, masking a volume problem as a rate problem?
A stage-age distribution check, how long deals sit in each stage, usually surfaces the real issue within a day.
Levers that actually move your numbers
Most teams try to fix win rate by writing better proposals. That helps, but the bigger gains usually come earlier in the process.
- Tighten go/no-go criteria with a short qualification checklist: budget confirmed, decision timeline known, and a credible shot at being shortlisted, before committing proposal hours.
- Shorten cycle time by committing to a same-day or next-day first review and sending proposals within days of the discovery call rather than weeks.
- Use tiered pricing options and interactive, digital proposals instead of static PDFs to make it easier for buyers to say yes.
- Lower proposal cost per win with reusable content blocks, clearly assigned writing and review roles, and standardized pricing modules instead of rebuilding estimates from scratch each time. Learn more about effective budget pacing strategies for campaigns to optimize your resource allocation.
- Build a lost-bid review step into every closed opportunity so recurring weaknesses, pricing, scope gaps, response time, get fixed instead of repeated.
Pro Tip: Review your last ten losses for one recurring theme before you touch pricing or messaging: a single fixable pattern usually explains more losses than you expect.
Where to pull reliable pipeline data
Your metrics are only as good as the systems feeding them. A CRM or dedicated bid-tracking tool should be the single source of truth for stage, dates, and opportunity value, not a spreadsheet someone updates when they remember.
- Keep stage definitions identical across every user so “proposal submitted” means the same thing to everyone on the team.
- Maintain field hygiene on contacts, dates, and status so stale records get flagged and removed instead of quietly inflating your pipeline.
- For public-sector work, cross-reference opportunities against official listings; the Sam and related award data provide a primary source for validating wins and reconciling bid outcomes against the Federal Acquisition Regulation (FAR) 15.201, which governs source-selection milestones.
- Track engagement signals like proposal views and stakeholder activity where your tools support it; a proposal that nobody opens tells you something before the decision ever comes back.
A subcontractor’s view of pipeline priorities
For commercial subcontractors, proposal-stage win rate and proposal cost per win matter more than raw lead count, because estimating hours are expensive and finite. When digital bid tracking connects directly to takeoff and labor data, denominators get cleaner: a “proposal submitted” ties to an actual estimate, not a guess. That connection makes forecasting more reliable and makes it easier to spot which opportunities are worth the next bid cycle. For more on how win-rate discipline plays out in subcontracting specifically, see why commercial subcontractors track bid win rates.
What bid pipeline metrics are and why they matter
Bid pipeline metrics, sometimes called pipeline KPIs, are the measurements that track opportunities as they move from lead to submitted proposal to won or lost contract. Their purpose is diagnostic: they tell a bid or business development team where opportunities stall, how much effort each win costs, and whether the pipeline has enough volume and quality to hit a revenue target.
Unlike a simple sales funnel, a bid pipeline usually involves a formal proposal or tender process with defined submission deadlines, review stages, and often a written evaluation from the buyer. That structure makes pipeline metrics especially useful for go/no-go decisions: before committing estimating or proposal-writing hours, a team can check historical win rates for similar opportunities, typical cycle length, and proposal cost to decide whether a specific bid is worth pursuing.
Used well, these metrics do three things: they flag qualification problems before hours get wasted, they show where process delays cost deals, and they quantify the true cost of winning a given type of contract. Used poorly, inconsistent denominators or stale records, they produce numbers that look precise but mislead every decision built on them. The rest of this guide focuses on getting the measurement right first, because a clean metric beats a sophisticated one.
How market conditions and competition change your benchmarks
The same pipeline process can produce very different win rates depending on what is happening outside your organization. When competition intensifies, whether from more bidders chasing the same contracts or from new entrants undercutting on price, win rates tend to compress even when your proposal quality has not changed. Treating a market-driven dip as a team performance problem leads to the wrong fix.
Economic conditions shift pipeline volume too. In a slower construction or procurement market, fewer opportunities circulate, which can push coverage ratios down even when qualification discipline stays the same. In a busier market, the opposite happens: more opportunities flow in, but each one may get less attention, which can quietly lower proposal quality and advancement rates.
Public-sector pipelines carry their own external variable: procurement rule changes. Updates to source-selection procedures or solicitation requirements, the kind governed by federal acquisition regulations, can shift how long opportunities sit in each stage or how many bidders compete for a given award. Factor these conditions into benchmark comparisons rather than measuring your team against a flat industry number regardless of context. A win rate that holds steady during a downturn in bid volume is a stronger signal than the raw number suggests.
How team skills and roles show up in the numbers
Pipeline metrics reflect process, but they also reflect the people running that process. A proposal writer’s ability to translate technical scope into a compelling, well-organized response shows up directly in proposal-stage win rate. An estimator’s accuracy shows up in whether your cost per win stays reasonable or creeps up from rework and missed line items.
Role clarity matters as much as individual skill. When qualification, writing, pricing, and review responsibilities are not clearly assigned, proposals move slower and reviewer feedback gets inconsistent, both of which show up as longer time-to-close and lower quality scores. Teams that assign a single accountable reviewer per proposal, rather than a rotating cast, tend to catch errors earlier and submit on time more often.
Experience with a specific buyer type or sector also affects outcomes in ways a generic win rate will not reveal. A team that has worked with a particular facility owner or agency repeatedly tends to anticipate evaluation criteria better than a team bidding cold, which is one reason segmenting metrics by customer type matters more than tracking one blended number. Coaching and feedback loops close this gap over time: a short debrief after every loss, tied back to the specific reviewer or writer involved, turns individual experience into a team-wide asset instead of knowledge that leaves when one person does.

Segmenting your metrics by project size, customer, and sector
A single blended win rate hides more than it reveals. Segmenting by project size is the most common starting point: small, fast-turnaround jobs typically close faster and at a different rate than large, multi-stage contracts, and blending them produces an average that describes neither group accurately.
Customer type is the second useful cut. Public-sector buyers follow formal, rule-bound evaluation processes, while private commercial clients may decide faster and weigh relationships more heavily. Tracking these separately shows whether your process is tuned for one type at the expense of the other.
Sector or trade specialization matters too. A subcontractor bidding across multiple trades or facility types will often see meaningfully different win rates by sector, since competitive intensity and buyer sophistication vary. Segmenting reveals where to concentrate business development effort and where proposal cost per win is quietly too high to justify continued pursuit.
A practical approach: keep your top-line dashboard at the blended level for leadership reporting, but maintain segmented views for your own decision-making. When a blended number moves, the segmented view tells you whether the shift came from one category or spread evenly, which changes what you do next.
Where bid metrics data quality breaks down
Most bad pipeline metrics trace back to a handful of recurring data problems, not a flawed formula. The most common is denominator drift: one person logs “opportunity” as any inbound inquiry while another only logs qualified leads, and the resulting win rate numbers are not comparable even though they sit in the same report.
Stale records are the second major issue. An opportunity marked “pursuing” for six months with no logged activity inflates pipeline coverage and understates win rate, since it counts as an open opportunity that never resolves. Regular pipeline hygiene reviews, flagging anything untouched for 60 to 90 days, catch this before it skews a quarterly report.
Inconsistent stage definitions cause similar damage. If “proposal submitted” means a draft sent for internal review to one team member and a document delivered to the client to another, time-to-close and proposal-stage win rate both become unreliable.
Finally, proposal cost is often undercounted because it only captures the writer’s hours and skips estimator time, management review, and overhead. That understatement makes proposal cost per win look better than it actually is, which can justify continuing to chase low-value bids. A short written data dictionary, defining each stage and field the same way for everyone entering data, fixes most of this without new software.
Putting the analysis to work: three examples
Example one: a team raises its qualification bar. After noticing a wide gap between pipeline-stage and proposal-stage win rate, a bid team adds a go/no-go checklist requiring confirmed budget and a credible shortlisting chance. Within a quarter, fewer proposals go out, but proposal-stage win rate rises because the team only writes for opportunities it can actually win.
Example two: a slow review cycle gets fixed. A team tracking time-to-first-review finds proposals sitting three days before anyone looks at them. Committing to next-day review shortens the overall cycle, and more proposals get submitted before competitors, directly improving the advancement rate.
Example three: segmented reporting reveals a hidden drag. A blended win rate looks acceptable, but segmenting by project size shows that large contracts are quietly underperforming while small jobs carry the average. That finding redirects business development effort toward the project sizes that convert best, rather than spreading pursuit hours evenly.
Each example starts with the same move: look at a specific metric, isolate what it is actually telling you, and change one process variable before touching everything at once.
Why selectivity usually beats volume
My own read on bid pipelines: most teams would win more by bidding less. Test a strict qualification gate on roughly a fifth of your incoming opportunities this quarter and track the outcome. You will likely see short-term revenue dip as fewer proposals go out, but proposal cost per win and win rate both tend to improve once effort concentrates on winnable work.
— Jen Reese
How Won2Build helps you track and improve these numbers
We built Bid Track to centralize opportunity stages, dates, and estimate values in one place, so your denominator stays consistent instead of drifting between spreadsheets and memory. Linking estimates directly to outcomes means a “proposal submitted” always ties back to a real number, not a guess.
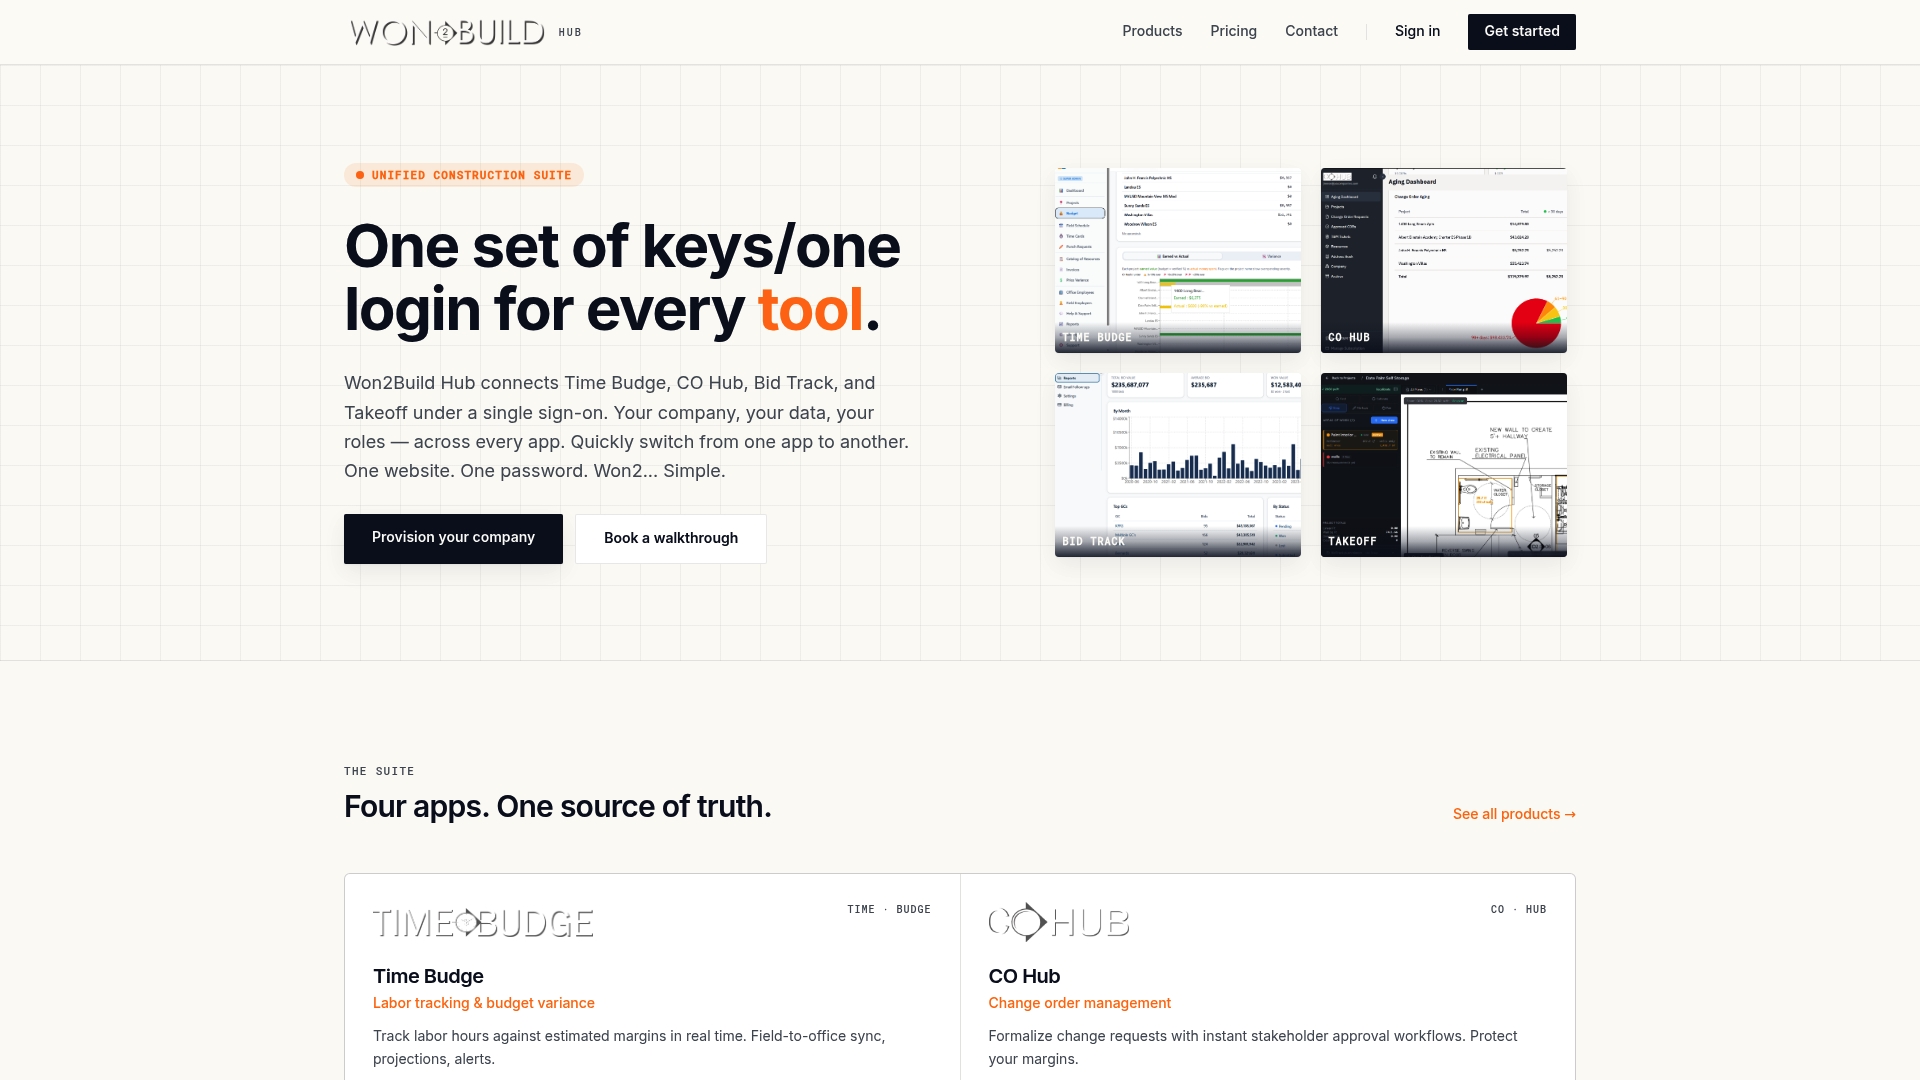
- Bid Track keeps every opportunity’s stage, value, and timeline in one record instead of scattered files.
- The Hub connects Takeoff, Time Budge, and CO Hub through a single login, cutting the double entry that creates phantom or duplicate opportunities.
- Real-time sync between field and office keeps reviewer feedback and stage updates current instead of stale.
If cleaner pipeline data and fewer manual reconciliations sound useful, check pricing for the full suite and see which modules fit your current workflow.
FAQ
What are pipeline metrics?
Pipeline metrics are the measurements that track opportunities as they move from initial lead to submitted proposal to a won or lost decision. They typically include win rate, pipeline coverage ratio, proposal cost, and time-to-close, each answering a different question about targeting, effort, or speed.
What are the key metrics and KPIs to track in procurement?
The core KPIs include win rate (often split by pipeline-stage versus proposal-stage), pipeline coverage ratio, tender or proposal cost, bid-to-no-bid ratio, and a quality score based on reviewer or client feedback. Practitioner guidance consistently lists these alongside return on bid activity as the essentials for a working dashboard.
What is a healthy pipeline coverage ratio?
A healthy coverage ratio depends on your historical win rate: teams with lower win rates need a higher pipeline-to-target multiple to reach the same revenue goal, while teams with stronger conversion can run leaner. There is no single universal number, which is why coverage should be calculated against your own historical conversion data rather than a generic industry figure.
How often should I review my bid pipeline metrics?
A 90-day rolling report works well for most teams because it smooths out the natural lumpiness of bid cycles while still catching problems quickly. Pair it with a shorter 30-day check for process issues like slow reviews, and a 365-day view for year-over-year trend comparisons.
Why does my win rate look different in every report?
The most common cause is a denominator mismatch: pipeline-stage win rate, proposal-stage win rate, and revenue-weighted win rate all measure different things and will produce different numbers from the same set of deals. Align every report to a single, clearly defined denominator, we recommend proposals sent, before comparing results across teams or time periods.
Sources
Recommended
One login for estimating, bid tracking, change orders, and labor.
The Hub is free. Pay only for the apps you turn on.
Create your free Hub account- Managers: Make Mobile Field Workflows Resilient for 72 Hour OutagesPlaybook for field managers: offline first mobile workflows, resilient sync and conflict handling, compliance first AI guardrails, and practical pilot steps.
- Daily Signed Records: Force Account Tracking for Managers & InspectorsField checklist for project managers and inspectors to keep force account tracking audit-ready: use daily signed records for labor, equipment, and...
- Stop Timecard to Report Drift: Labor Cost Codes for SubcontractorsFix the timecard to report chain with labor cost codes that tie crews to budgets. Includes a 6 code starter and a burdened rate example.