
Labor Cost Calculator for Contractors: Get Fully Burdened Rates Fast
Calculate your labor costs quickly with our effective calculator. Get fully burdened rates and make accurate job estimates with ease.

A labor cost calculator gives you two numbers that matter: your fully burdened hourly rate and your burden multiplier. Every job estimate, change order, and payroll forecast runs through them.
The formulas:
- Fully burdened hourly = (Annual wage + employer taxes + insurance + benefits + other labor costs) ÷ productive hours
- Burden multiplier = Fully burdened hourly ÷ base wage
Pull your payroll register, workers’ comp policy, and benefits invoices before you start.
Key Takeaways
Accurate labor costing requires trade-specific burden rates, productive hours (not paid hours) as the denominator, and quarterly reconciliation against GL actuals.
| Point | Details |
|---|---|
| Use productive hours, not paid hours | Paid hours overstate the denominator and understate your fully burdened rate by 5–15%. |
| Build per-classification burden rates | Workers’ comp alone can shift the burden multiplier by 0.10–0.20 between low- and high-risk trades. |
| Construction burden runs 25–40% | Rates below 25% usually signal missing inputs; rates above 40% warrant a line-by-line audit. |
| Verify inputs against IRS, BLS, and SBA | Use company actuals first; replace benchmarks as soon as payroll registers and invoices are available. |
| Won2build Time Budge keeps rates current | Automates time capture, applies per-role burden rates, and syncs loaded labor into estimates and job cost reports. |
Table of Contents
- What inputs does a labor cost calculator actually need?
- How to calculate fully burdened labor cost step by step
- Worked examples: $20/hour worker and a salaried supervisor
- How construction subcontractors build a loaded rate by trade
- How to apply your results to bids, budgets, and forecasts
- Common mistakes that cause underbids and how to fix them
- Where to verify your inputs using authoritative U.S. sources
- What most guides get wrong about labor burden
- Won2build’s Time Budge automates what spreadsheets can’t
- Sources
What inputs does a labor cost calculator actually need?
Every field in the calculator maps to a real document you already have. The SBA recommends including payroll taxes, benefits, insurance, and overhead when estimating total employee cost, and it points to payroll registers and invoices as the primary sources.
Inputs by category:
- Base wage or annual gross pay — payroll register, last W-2
- Paid hours vs. productive hours — timecard export; subtract PTO, holidays, training days
- Overtime pay and hours — payroll register, separate from straight-time
- Employer FICA — 7.65% of gross wages (6.2% Social Security up to the wage base + 1.45% Medicare, no cap)
- FUTA — 6% on the first $7,000 of wages, though most employers qualify for a credit that drops the effective rate to about 0.6% when SUTA is paid on time (IRS FUTA credit guidance)
- SUTA — varies widely by state and experience rating; check the Tax Policy Center or your state labor department for current rates
- Workers’ comp premiums — workers’ comp policy schedule, broken out by classification code
- General liability allocation — GL policy premium ÷ total payroll, then × employee’s annual wages
- Health insurance and retirement match — monthly benefits invoices × 12
- PTO cost — (hourly rate × PTO hours) treated as a cost with zero productive output
- Tools, PPE, vehicle allocations — general ledger expense accounts tied to field labor
- Training and supervision overhead — GL accounts for training, foreman time not billed to a job
Key definitions:
| Term | Definition | Where to find it |
|---|---|---|
| Base wage | Straight-time hourly or annual gross pay before any additions | Payroll register |
| Productive hours | Paid hours minus PTO, holidays, and non-billable downtime | Timecard export |
| Loaded annual cost | Sum of all employer costs for one worker per year | Payroll + policy + benefits invoices |
| Burden rate | Additional employer costs as a percentage of base wages | Calculated |
| Burden multiplier | Fully burdened hourly ÷ base hourly wage | Calculated |
| Labor cost percentage | Labor cost ÷ total project revenue × 100 | Job cost report |
How to calculate fully burdened labor cost step by step
The five-step method runs: base wage → mandatory payroll taxes → insurance → benefits and other costs → divide by productive hours. Here is how to execute each step in a spreadsheet.
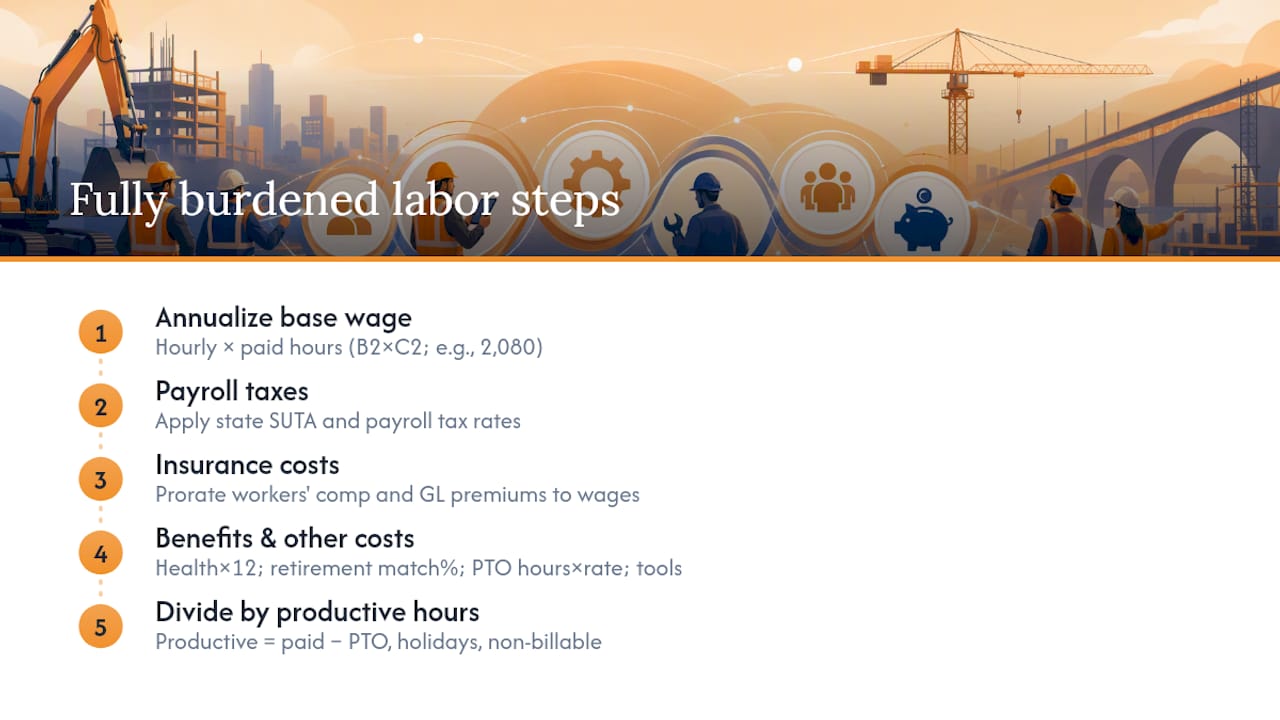
Step 1 — Convert to an annual base. If the worker is hourly, multiply: =B2*C2 where B2 = hourly rate and C2 = total paid hours per year (typically 2,080 for full-time).
SUTA depends on your state and experience rating — pull the actual rate from your state account.
Step 3 — Add insurance costs. Workers’ comp is quoted per $100 of payroll by classification code; divide the annual premium by total payroll, then multiply by the employee’s wages. Add the GL allocation the same way.
Step 4 — Add benefits and other annual costs. Health insurance: monthly premium × 12. Retirement match: gross wages × match percentage. PTO: hourly rate × PTO hours. Tools, training, and vehicle allocations: pull from GL accounts and divide by headcount or payroll share.
Step 5 — Divide by productive hours. Productive hours = paid hours minus PTO, holidays, and non-billable time. A full-time field worker with two weeks PTO and ten holidays works roughly 1,960–2,000 paid hours but may log only 1,800–1,850 productive (billable) hours after downtime.
Fully burdened hourly = Total loaded annual cost ÷ productive hours
Overtime treatment: The overtime premium (the extra 0.5× above straight time) is an additional cost. Add the total annual overtime premium dollars to the loaded cost before dividing. Do not double-count the straight-time portion, which is already in gross wages.
Annualizing monthly or quarterly costs: Multiply monthly figures by 12. For quarterly workers’ comp audits, use the most recent annual audit figure and adjust when the new one arrives.
Statistic check: The BLS Employer Costs for Employee Compensation release is the standard benchmark for sanity-checking your benefit-per-hour allocations — useful when invoices are delayed or you are estimating for a new hire class.
Pro Tip: Build the formula in a single spreadsheet row per employee. Lock the productive-hours cell as an absolute reference ($F$2) so you can test different utilization scenarios without breaking the formula.
Worked examples: $20/hour worker and a salaried supervisor
Example 1: $20/hour field worker
Productive hours: 2,080 paid − 80 PTO − 80 holidays − 40 downtime = 1,880 hours
Fully burdened hourly = $57,989 ÷ 1,880 = $30.84
Burden multiplier = $30.84 ÷ $20.00 = 1.54
That means every dollar of base wage costs the employer $1.54 fully loaded. If you bid this worker at $20/hour, you lose $10.84 per hour before a single dollar of overhead or profit.
Example 2: Salaried supervisor at $75,000/year
Apply the same steps. Productive hours for a supervisor might be lower — say 1,750 — because of meetings, admin, and multi-site travel. Add the same tax and benefits stack. If total loaded cost reaches $105,000, the fully burdened rate is $105,000 ÷ 1,750 = $60.00/hour. That number belongs in every job estimate where supervision time is allocated.
That sits at the high end of typical construction ranges and signals a need to review crew mix or scope.
How construction subcontractors build a loaded rate by trade
Trade work adds two variables that a generic employee cost analysis misses: classification-specific workers’ comp rates and utilization differences between trades.

Workers’ comp rates vary dramatically by trade classification. A finish carpenter carries a lower rate than a roofer or ironworker. That single line item can shift the burden multiplier by 0.10–0.20 depending on the classification. Miter notes that construction burden rates commonly fall in the 25–40% range, but trade differentiation is what makes that range meaningful for accurate bids.
Generic trade comparison (illustrative):
These are illustrative ranges. Your actual workers’ comp rate comes from your policy schedule by classification code.
From fully burdened rate to billable rate: Add company overhead (divide total annual overhead by total productive field hours) and your target markup. A common structure: Billable rate = Fully burdened rate × (1 + overhead %) × (1 + profit %).
Contractors using bottom-up estimating apply this billable rate to each task’s estimated hours, which gives the most defensible labor line in a bid.
Pro Tip: On multi-site crews, export timecards by job code weekly and calculate productive hours per site separately. Blending all sites into one average masks low-utilization jobs that quietly erode margins.
How to apply your results to bids, budgets, and forecasts
Once you have the fully burdened hourly rate, the applications are direct.
- Job estimates: Multiply estimated task hours by the fully burdened rate to get the labor line item. Place this in your estimate template before adding overhead and markup.
- Change orders: Any T&M change order should use the fully burdened rate, not the base wage. Billing at base wage on a change order means you absorb every burden cost yourself.
- Payroll forecasting: Multiply projected hours per period by the fully burdened rate to forecast total labor expense. This feeds directly into cash flow projections.
- Variance analysis: Compare actual burdened cost per hour (from job cost reports) against the estimated rate. A persistent gap signals a burden input that needs updating.
Labor typically represents a significant portion of total construction project budgets, often varying widely by trade and project scope. Protecting margins requires that burden rates stay current, not just accurate at bid time.
Benchmark note: The BLS Employer Costs for Employee Compensation data provides an independent check on whether your benefit-per-hour allocation is in a reasonable range for your industry and region.
Common mistakes that cause underbids and how to fix them
The most expensive error is using paid hours instead of productive hours as the denominator.
Other frequent omissions, per ConstructionCostAccounting:
- Leaving out workers’ comp entirely or using a blended rate across all trades
- Ignoring PTO as a cost (it is a cost — the worker is paid but produces nothing)
- Using last year’s SUTA rate without checking for experience-rating changes at renewal
- Skipping low-frequency costs: bonuses, certification renewals, safety training
Accuracy fixes:
- Run a quarterly reconciliation: compare your estimated burden rate against actual costs from the GL. A 5% variance is worth investigating.
- Keep a rolling 12-month average for volatile lines like overtime and training.
- Reconcile workers’ comp and GL insurance at every policy renewal — rates shift.
- Build separate burden rates by classification, not one company-wide average.
Pro Tip: Create a separate burden-rate profile for each job classification in your payroll system. A framer and a project manager carry different workers’ comp codes, different overtime exposure, and often different benefit elections. One blended rate hides both overcharges and undercharges.
Where to verify your inputs using authoritative U.S. sources
Company actuals beat benchmarks every time. When you have a payroll register, a workers’ comp policy schedule, and benefits invoices, use those numbers. Benchmarks are for sanity checks and new-hire estimates only.
Authoritative sources by input type:
- FUTA rate and credit — IRS FUTA credit reduction page; confirm credit eligibility annually
- SUTA rates — your state’s labor or unemployment department; the Tax Policy Center aggregates state rates for comparison
- Benefit cost benchmarks — BLS Employer Costs for Employee Compensation; use when invoices are unavailable or for new-hire planning
- Total employer cost guidance — SBA employer cost guide; practical checklist for small businesses
- Internal records — payroll register (wages, taxes withheld), workers’ comp policy schedule (rates by code), benefits invoices (health, dental, retirement), GL expense accounts (tools, training, vehicles), timecard exports (productive vs. paid hours)
Rule of thumb: Use agency benchmarks to set a range, then replace each benchmark with your company actual as soon as the document is available. A burden rate built entirely on benchmarks can be off by 8–12 percentage points in either direction.
What most guides get wrong about labor burden
The real problem is that most small contractors treat burden as a single percentage applied uniformly across all workers. A finish carpenter and a roofer do not carry the same workers’ comp rate. A part-time worker and a full-time salaried supervisor do not share the same benefit cost per hour. Blending them into one rate means you are overcharging some jobs and undercharging others, and the undercharges are usually the high-risk, high-labor jobs where margins are already thin.
The second thing guides understate is how much productive hours matter. Contractors who track labor hours accurately by job code consistently find that actual productive hours run 8–12% below paid hours. That gap, left uncorrected, inflates every bid’s labor line — and then the job comes in over budget anyway because the estimate was built on an understated rate.
The fix is not complicated. Build one burden-rate profile per classification, update it at every policy renewal, and reconcile it quarterly against GL actuals. That process takes about two hours a quarter and prevents the kind of systematic underbidding that quietly kills margins over a full year.
Won2build’s Time Budge automates what spreadsheets can’t
Spreadsheet burden calculations break the moment a policy renews, a new worker joins a different classification, or a foreman splits time across three jobs. Won2build’s Time Budge solves that directly.

Time Budge captures field time by job code and worker classification in real time, applies per-role burden rates automatically, and syncs loaded labor costs into job cost reports and bid estimates without manual re-entry. When a workers’ comp rate changes at renewal, you update it once and every open estimate recalculates. The result: fewer underbids, faster estimate assembly, and a payroll forecast that reflects what you actually spend rather than what you guessed a year ago.
Won2build is built specifically for commercial construction subcontractors, with mobile field access, bilingual interface, and a single login across Time Budge, Bid Track, CO Hub, and Takeoff. Start a free trial or request a demo to see how burden rates stay current without a quarterly spreadsheet rebuild.
Sources
Recommended
One login for estimating, bid tracking, change orders, and labor.
The Hub is free. Pay only for the apps you turn on.
Create your free Hub account- 7 Concrete Takeoff Steps Estimators Use to Avoid Ordering ShortfallsFollow seven concrete takeoff steps to calculate cubic yards, size rebar and formwork, convert volumes to supplier units, and verify quantities before bid...
- Are E-Signature Change Orders Legal and Worth the Switch?E-signature change orders streamline your workflow, ensuring faster approvals, fewer disputes, and quicker invoicing—discover the benefits now!
- How to Link Takeoff to Estimate for Accurate BidsLink your takeoff quantities to your estimate for accurate bids. Discover the seamless integration method that reduces errors and saves time.