
Project Profitability Reports: Metrics, Formulas & Runbook
Discover how project profitability reports reveal revenue, costs, and margins, helping managers make data-driven decisions for success.

A project profitability report shows each project’s revenue, direct costs, allocated overhead, and resulting profit or margin in one place, so project managers and finance teams can see immediately which jobs are making money and which are bleeding it. Run one before a project closes and you can still act. Run one after and you’re just doing forensics.
Three uses drive most of the demand for these reports. First, they identify losing projects early enough to trigger corrective action, whether that’s capturing unbilled change orders, renegotiating a subcontract, or accelerating collections. Second, they expose estimate accuracy gaps, so the next bid doesn’t repeat the same pricing mistake. Third, they give finance a reconciled view of project-level gross profit that ties back to the general ledger, which is what auditors and CFOs actually need.
Project managers, project accountants, and FP&A analysts are the primary users. The sections below cover the exact fields, formulas, data mappings, a step-by-step runbook, dashboard templates, and governance rules to make these reports reliable and repeatable.
Key Takeaways
Project profitability reports are only as reliable as the data feeding them: daily time capture, a locked CO workflow, and a reconciled overhead allocation are the three controls that determine whether the numbers are trustworthy.
| Point | Details |
|---|---|
| Run life-to-date and period views | Life-to-date shows total job health; period views catch recent margin erosion before it compounds. |
| Reconcile unbilled COs at every close | Approved but uninvoiced change orders suppress revenue and distort margin; clear them every billing cycle. |
| Lock the estimate baseline before the job starts | Variance analysis is meaningless without a fixed original estimate to measure against. |
| Apply RNOA decomposition for multi-period forecasting | Decomposing operating profitability into margin, turnover, and funding ratio yields more stable, forecastable components than headline margin alone. |
| Won2Build Hub closes the field-to-office data gap | Time Budge, CO Hub, Bid Track, and Takeoff feed accurate, real-time project data into profitability reports without manual re-entry. |
Table of Contents
- What does a project profitability report actually contain?
- Key profitability metrics and formulas every project team needs
- Where does the data actually come from?
- How to run a project profitability report, step by step
- What should your report template and dashboard look like?
- How do you read the numbers and decide what to do?
- Common errors that make profitability reports misleading
- Who owns the report and how often should it run?
- Advanced profitability decomposition: what RNOA tells you that margin alone doesn’t
- How to actually improve project profitability using report data
- The gap between what these reports promise and what actually happens in the field
- Won2Build closes the data gaps that make profitability reports unreliable
- Sources
What does a project profitability report actually contain?
A job profitability report for construction lists total costs to date, total income to date, and gross profit per project, and it’s the standard tool for identifying which jobs are making money and which are not. The layout is typically one summary row per project, with expandable detail by cost category or task.
Core fields in a standard report
Every reliable project profitability report includes these fields:
- Project ID / Project Name — the unique identifier linking the row to your job ledger
- Revenue invoiced — amounts billed to the client on approved invoices
- Recognized revenue — revenue earned under the applicable recognition method (percentage-of-completion or milestone), which may differ from invoiced amounts
- Committed revenue — contract value plus approved change orders not yet invoiced
- Direct costs — labor, materials, subcontractors, and equipment charged directly to the job
- Committed costs — open purchase orders and subcontract commitments not yet billed
- Recognized costs — costs matched to recognized revenue under accrual accounting
- Overhead allocation — indirect costs (supervision, insurance, equipment depreciation) distributed to the project by a chosen allocation method
- Gross profit ($) — revenue minus direct costs before overhead
- Net profit ($) — gross profit minus allocated overhead
- Gross margin (%) and net margin (%) — the dollar figures expressed as a percentage of revenue
Common filters include period (month, quarter, life-to-date), customer, contract status (active, complete, on-hold), and project manager.
Short glossary
COGS (Cost of Goods Sold): In construction, this is the sum of direct costs charged to a job, including labor, materials, subcontractors, and equipment.
Indirects / Overhead: Costs that cannot be traced to a single project, such as office rent, general liability insurance, and project management salaries, allocated across jobs using a rate or pool.
Committed vs. recognized revenue: Committed revenue is the total contracted amount you expect to earn. Recognized revenue is what accounting rules say you’ve earned so far, based on work completed.
Realization rate: Actual revenue collected divided by the value of hours worked at standard billing rates. A rate below 1.0 means you’re leaving money on the table.
Gross profit: Revenue minus direct project costs. It tells you whether the job itself is profitable before company overhead enters the picture.
Net profit: Gross profit minus allocated overhead. This is the number that flows to the company’s bottom line.
Key profitability metrics and formulas every project team needs
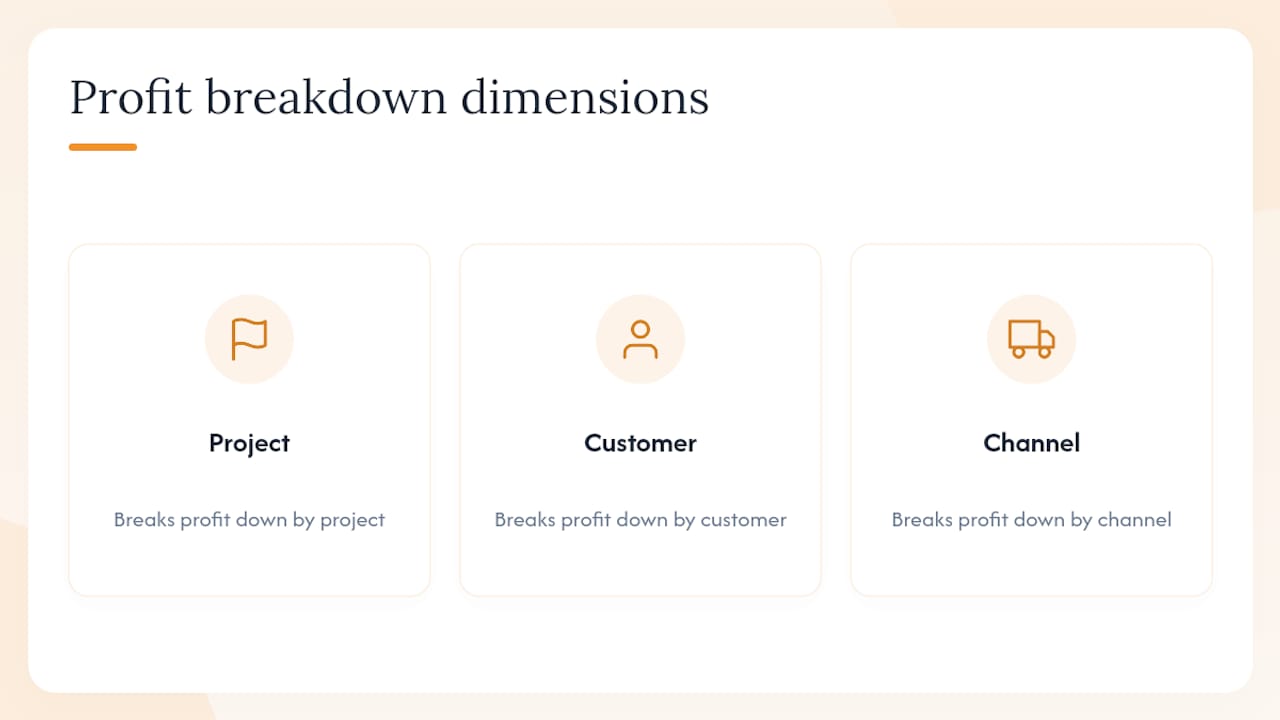
The formulas below are the ones profitability analysis practitioners use to break profit down by project, customer, and channel, combining financial and operational data to reveal true profit drivers. Each formula maps to specific ledger fields so you can trace every number back to its source.
Primary KPIs and their formulas
| KPI | Formula | Primary data source |
|---|---|---|
| Gross Profit ($) | Revenue Invoiced − Direct Costs | Invoice lines; job ledger entries |
| Gross Profit Margin (%) | Gross profit percentage | Derived from above |
| Net Profit ($) | Gross Profit − Overhead Allocation | Overhead pool allocation table |
| Net Profit Margin (%) | Net profit percentage | Derived from above |
| Realization Rate | Actual Revenue ÷ (Hours × Standard Rate) | Timesheets; billing rate table |
| Estimate Accuracy | Estimate variance percentage | Job ledger vs. original estimate |
| ROI on Project | Net profit percentage | Job ledger; overhead allocation |
| Contribution Margin | Revenue − Variable Direct Costs | Job ledger (variable cost lines only) |
Worked example
Consider a mechanical subcontractor on a $500,000 fixed-price job:
A realization rate below 1.0 means the crew recovers less than the full dollar of labor at standard billing rates. That’s worth investigating: six cents per labor dollar lost to non-billable rework or untracked time adds up fast on a $180,000 labor budget.
Calculation caveats
- Unbilled work-in-progress (WIP): If work is complete but not yet invoiced, recognized revenue will exceed invoiced revenue under percentage-of-completion. Exclude WIP from cash-basis reports; include it in accrual reports.
- Committed purchase orders: Show committed costs as a separate column rather than folding them into recognized costs. Mixing the two overstates actual spend.
- Cash vs. accrual: Cash-basis reports show only invoiced revenue and paid costs, which can make a project look profitable when significant costs are still unpaid. Accrual-basis reports match revenue and costs to the period earned, giving a more accurate picture of project health.
Building accurate job cost estimates upstream is what makes the estimate accuracy KPI meaningful. Without a solid baseline, the variance number is noise.
Where does the data actually come from?
Project profitability reports in ERP systems pull from tables including Job, Job Task, and Job Ledger Entries, alongside timesheets and invoices, to compare actual costs against contract prices. Getting the field-to-source mapping right is the difference between a report finance trusts and one they have to manually reconcile every month.
Field-to-ledger data map
| Report field | Source table / module | Notes |
|---|---|---|
| Revenue invoiced | Accounts receivable / invoice lines | Filter by project ID; exclude credit memos |
| Recognized revenue | Revenue recognition schedule | Requires % complete or milestone flag |
| Committed revenue | Contract header + approved COs | Sum contract value + all approved CO amounts |
| Direct labor cost | Timesheet entries → job ledger | Must be posted; unposted time creates gaps |
| Materials cost | Job ledger (material type) | Match to vendor bills, not PO commitments |
| Subcontractor cost | Vendor bills / AP ledger | Filter by job and cost code |
| Committed costs | Open PO lines | Exclude received/billed POs to avoid double-count |
| Overhead allocation | Overhead pool table | Apply rate to direct labor $ or total direct cost |
| Change orders | CO log / CO ledger | Include only approved COs in revenue; track pending separately |
Systems like Odoo aggregate revenues and costs through an analytic account linked to the project, splitting revenues into sold, delivered, and invoiced buckets alongside costs from timesheets, purchase orders, and vendor bills. Whatever system you use, the analytic account or job code is the join key that ties every transaction to the right project.
Reconciliation checklist
Run these checks before distributing any report:
- GL tie-out: Total direct costs in the project report must equal the sum of job-coded entries in the general ledger for the same period.
- AR tie-out: Revenue invoiced must match the AR sub-ledger filtered by project.
- Unposted time: Pull a list of timesheet entries in “draft” or “pending” status. Any unposted hours are missing from labor cost.
- Unbilled COs: Compare the approved CO log to invoiced amounts. The gap is unbilled revenue that’s inflating apparent cost and suppressing margin.
- Open POs: Confirm committed costs include all open PO lines. Missing commitments make the project look more profitable than it is.
- Overhead rate confirmation: Verify the allocation rate applied matches the rate approved for the current fiscal period.
How to run a project profitability report, step by step
Pre-run checklist
Before generating the report, confirm:
- All timesheets through the cut-off date are posted and approved
- All vendor bills and subcontractor invoices through cut-off are entered and matched to job codes
- Approved change orders are logged and linked to the correct project
- Open purchase orders are captured in the committed cost module
- The overhead allocation rate for the period is confirmed with the finance lead
- The reporting period (month-end, quarter-end, or life-to-date) is agreed with stakeholders
Pro Tip: Set a hard data cut-off 24 hours before the report run. Any transactions posted after cut-off go into the next period. Chasing late entries after distribution destroys trust in the numbers.
Step-by-step run instructions
- Select projects. Filter by active status, or choose specific project IDs if running a targeted review. For executive summaries, include all active and recently completed projects.
- Choose the period. Run both a current-period view (month or quarter) and a life-to-date view. Period views catch recent deterioration; life-to-date shows the full picture.
- Include committed amounts. Toggle on committed costs and committed revenue columns. A report without commitments understates exposure on jobs with large open POs.
- Apply overhead allocation. Select the allocation method (percentage of direct labor, percentage of total direct cost, or fixed rate per project). Document which method was used in the report header.
- Run and review. Before exporting, scan for negative gross margin rows and projects where actual cost exceeds committed revenue. Flag these for the interpretation step.
- Export. Export to CSV or Excel for further analysis. For Power BI, export the raw data tables and refresh the model. Preserve the export timestamp and filter settings in a separate audit tab.
For real-time reporting on active jobs, a live dashboard connected to the field data feed is more useful than a monthly export. The export is for reconciliation and distribution; the dashboard is for daily decisions.
Two ways to build the report
Native ERP/PM report: Fastest to run, already tied to the GL, and requires no ETL. The downside is limited visualization and rigid column layouts.
Pull-to-Power BI or Excel: More flexible. Export the raw job ledger, timesheet, invoice, and CO tables, join them on project ID, and build your own model. Microsoft’s Power BI profitability report exposes KPIs including gross profit, net profit, and margins, with filtering by fiscal period, which is the baseline to replicate or extend.
What should your report template and dashboard look like?
Excel template structure
A practical Excel template for project profitability reports uses four sheets:
- Raw Data: One row per transaction (job ledger entries, timesheet lines, invoice lines, CO entries). This is the import tab, never edited manually.
- Reconciliations: GL tie-out, AR tie-out, and unposted-time checks. Color-coded cells flag variances above threshold.
- Calculations: Pivot table pulling from Raw Data, computing gross profit, net profit, margins, and realization rate by project.
- Summary: One row per project with columns for revenue, direct costs, overhead, gross profit, gross margin %, net profit, net margin %, and a RAG (red/amber/green) status flag.
The summary row should be compact enough to print on one page per 20 projects. Add a sparkline column showing the last six months of gross margin trend for each job.
Power BI dashboard layout
A well-built Power BI dashboard for financial performance reports includes:
- KPI cards at the top: total revenue, total gross profit, average gross margin %, and average net margin % for the selected period
- Project list with sparklines: sortable table of all projects with a mini trend line for gross margin
- Profitability waterfall: revenue → direct costs → gross profit → overhead → net profit, showing where value is lost
- Drill-through to cost detail: click any project row to see a breakdown by cost category and time period
- Slicers: project manager, customer, contract type, period, and project status
Dashboards should expose both dollar and percentage KPIs, and support drill-through to cost lines. Executives need trend KPIs; project managers need the detailed expense timeline. Build both views into the same model using a role-based filter or a toggle.
For budget tracking setup that feeds these dashboards reliably, the baseline configuration matters as much as the visualization layer.
How do you read the numbers and decide what to do?
Red flags to act on immediately
- Negative gross margin: The job is losing money before overhead even enters the picture. Stop and find out why before the next billing cycle.
- Realization rate below 0.85: More than 15% of labor value is unrecovered. Check for untracked rework, scope creep without a CO, or billing rate errors.
- Actual cost exceeding committed revenue: The project is heading toward a loss at completion. Escalate to the PM and review remaining scope.
- Large unbilled COs: Approved change orders that haven’t been invoiced are cash sitting on the table. Construction-specific job-profitability reports are most valuable when they include committed costs and unbilled change orders, because missing those items frequently explains large variance between reported and actual margins.
- Rapid margin erosion vs. estimate: If gross margin has dropped more than five percentage points from the original estimate, the job has a structural problem, not a timing issue.
Diagnostic steps
- Pull the timecard detail for the project and compare hours by trade to the estimate. Overruns in a specific trade point to productivity or scope issues.
- Review the change order log. Count pending COs not yet approved. Pending COs represent risk; approved-but-unbilled COs represent recoverable revenue.
- Check subcontractor bills against the subcontract value. Overbilling by a sub is a common source of cost overruns that don’t show up until the bill arrives.
- Compare the estimate’s unit costs to actual unit costs for materials. Price escalation mid-job is a legitimate variance; estimating error is a process problem.
Priority action list by timeframe
Immediate (this week):
- Contact PM on any project with negative gross margin or realization rate below 0.85
- Invoice all approved, unbilled change orders
- Post all unposted timesheets before the next billing cycle
30 days:
- Revise cost-to-complete estimates on jobs with margin erosion above five points
- Adjust labor rates or billing rates if realization rate issues are systemic
- Review pricing on similar upcoming bids using the estimate accuracy data
90 days:
- Implement process changes to capture COs faster (see Section 11)
- Evaluate whether overhead allocation method reflects actual cost behavior
- Schedule a formal estimate-vs-actual review for every completed project
Tailoring the report by audience
Site PM: Needs the gross margin trend, realization rate, and a list of pending COs. One page, updated weekly.
Project accountant: Needs the full field-to-ledger reconciliation, committed vs. recognized cost detail, and the unposted-time flag. Weekly, with a sign-off column.
CFO / executive: Needs total portfolio gross profit, net margin by project, and a ranked list of the five best and five worst performers. Monthly, with a one-paragraph narrative.
Common errors that make profitability reports misleading
- Incorrect overhead allocation: Applying a single flat rate to all projects distorts results when jobs vary significantly in size, duration, or labor intensity. Use separate rates for labor-heavy vs. equipment-heavy work, or allocate by direct labor hours rather than dollars.
- Missing or unposted time: Unposted timesheets understate labor cost and inflate gross margin. A project that looks profitable at mid-month may look very different once the week’s time is posted.
- Unbilled change orders: Approved COs not yet invoiced suppress revenue and make cost-to-revenue ratios look worse than they are. Track them in a separate column, not buried in the cost lines.
- Cash vs. accrual mismatch: Running a cash-basis report for a project with significant accrued costs produces a misleading margin. Decide on one recognition method and apply it consistently across all projects in the same report.
- Double-counting committed costs: Including both an open PO and the vendor bill for the same purchase overstates cost. Once a bill is received and matched, remove the PO from the committed column.
- Inconsistent estimate baselines: Comparing actual costs to an estimate that was revised mid-project without documentation makes the estimate accuracy KPI meaningless. Lock the original estimate as the baseline and track revisions separately.
- Small-job distortion: Net profit comparisons across projects of very different sizes are misleading. A $20,000 job with a 30% net margin and a $2,000,000 job with a 12% net margin are not comparable on a percentage basis alone. Use contribution dollars alongside margin percentages.
Understanding why contractors underbid is directly relevant here: systematic underbidding creates estimate baselines that make every project look like it’s overrunning, when the real problem is the original number.
Who owns the report and how often should it run?
Ownership matrix
| Role | Responsibility |
|---|---|
| Foremen / field crews | Post daily timesheets; confirm quantities installed |
| Project managers | Approve timesheets; log and submit change orders; review weekly summary |
| Project accountants | Validate data inputs; run reconciliations; flag variances |
| Finance lead | Sign off on report distribution; approve overhead rate; own audit trail |
Recommended cadence
- Daily: PMs check a live dashboard for labor cost vs. budget and any new CO activity. This is a health check, not a formal report.
- Weekly: Project accountants run the full reconciled report, post unposted time, and flag red-margin projects to the PM.
- Monthly: Finance lead distributes the executive summary with net margin by project, portfolio totals, and a narrative on significant variances.
Control checklist
- Reconcile project report totals to GL at every month-end before distribution
- Set a variance sign-off threshold (for example, any project with gross margin variance greater than three percentage points from the prior period requires a written explanation)
- Retain all exported reports with timestamps and filter settings for audit purposes
- Confirm all change orders are logged and status is current before each monthly close
- Document the overhead allocation rate and method used in each report’s header
Advanced profitability decomposition: what RNOA tells you that margin alone doesn’t
Gross margin tells you whether a project made money. Return on Net Operating Assets (RNOA) tells you why and whether it will keep doing so. A November 2023 empirical analysis shows that decomposing operating profitability into three drivers produces more persistent, forecastable components than headline return on equity, which is why finance teams doing multi-period forecasting should calculate RNOA components where data allows.
The three drivers
- Operating profit margin: Operating profit ÷ Revenue. Measures how efficiently the company converts revenue to operating profit.
- Operating asset turnover: Revenue ÷ Net Operating Assets. Measures how productively the company deploys its assets to generate revenue.
- Operations funding ratio: Net Operating Assets ÷ (Net Operating Assets − Operating Liabilities). Captures how much of the operating asset base is funded by operating liabilities (payables, accruals) rather than capital.
RNOA = Operating Profit Margin × Operating Asset Turnover × Operations Funding Ratio
When to use this decomposition
For a construction subcontractor, this decomposition is most useful at the company level when diagnosing persistent profitability problems across multiple periods, not for a single project. If operating profit margin is declining but asset turnover is stable, the problem is pricing or cost control. If turnover is declining, the company is deploying more assets per dollar of revenue, which often points to slow-moving equipment or receivables.
Pro Tip: The operations funding ratio tends to be stable over time, which makes it a reliable anchor for multi-period forecasts. If your ratio shifts significantly quarter over quarter, check for changes in payment terms with major subs or suppliers, since those directly affect operating liabilities.
The decomposition separates transitory items (a one-off project loss, a warranty claim) from structural drivers, so forecasts built on the three components are more reliable than forecasts built on headline margin alone.
How to actually improve project profitability using report data
The report tells you where the problem is. These steps fix it.
-
Tighten job costing at the estimate stage. Every cost code in the estimate should map to a matching cost code in the job ledger. If the estimate has 12 labor categories and the job ledger has 4, the variance analysis is useless. Align the two before the job starts. Construction market research for bidding is one input that sharpens the estimate baseline before the job even begins.
-
Capture time daily, not weekly. Weekly timesheet entry produces a week’s worth of cost that hits the report all at once, making mid-week decisions impossible. Daily mobile time entry, tied directly to the job code, gives the PM a current labor cost number every morning.
-
Implement a CO capture workflow. The single biggest source of margin erosion in construction is approved scope that never becomes an invoice. Here’s a simple workflow to close that gap:
- Field supervisor identifies out-of-scope work and logs it in the CO system the same day
- PM reviews and submits to the GC within 48 hours
- Finance flags any CO pending approval for more than 10 business days
- Approved COs are invoiced in the next billing cycle, not held for convenience
-
Match subcontractor invoices to scope. Before approving a sub bill, confirm the billed amount matches the work completed and the subcontract value. Overbilling by subs is common and rarely caught without a formal matching step.
-
Review estimate accuracy after every completed project. Run the estimate-vs-actual report within 30 days of project close. Identify the top three cost codes where actual exceeded estimate by more than 10%. Feed those findings into the next bid for similar work.
-
Measure the impact. After implementing daily time capture, compare the realization rate for the next three months to the prior three. After the CO workflow, compare unbilled CO balances at month-end. Numbers that don’t move after a process change mean the change didn’t stick.
Setting a solid budget baseline before the job starts is what makes steps 5 and 6 meaningful. Without a locked baseline, you’re measuring variance against a moving target.
The gap between what these reports promise and what actually happens in the field
Most project profitability reports fail not because the formulas are wrong, but because the data feeding them is late, incomplete, or inconsistently coded. The math is the easy part.
The pattern that shows up repeatedly: a project looks fine at mid-month because timesheets aren’t posted and the CO log hasn’t been updated. Then the month closes, everything hits at once, and the gross margin drops eight points in 48 hours. The PM is blindsided. Finance is frustrated. And the corrective window has already closed.
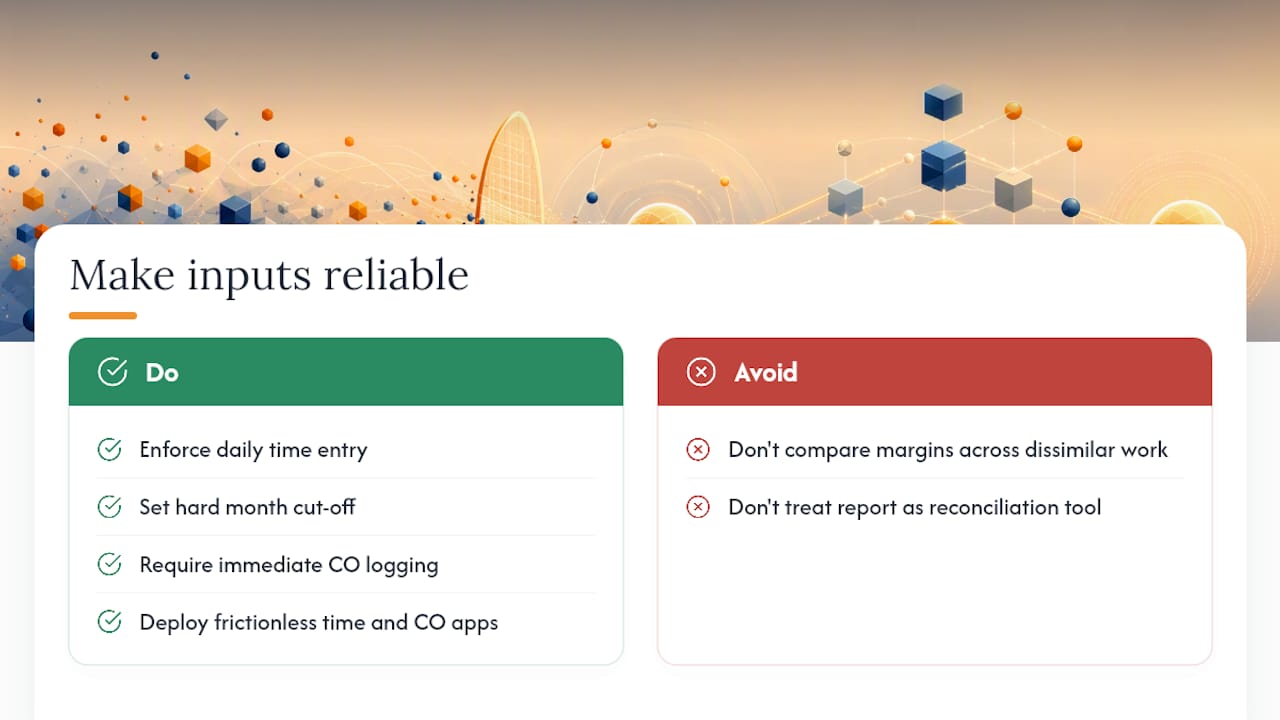
The fix isn’t a better report template. It’s daily discipline on data entry, a hard cut-off enforced by the finance lead, and a CO workflow that doesn’t let approved scope sit unlogged for two weeks. The report is only as good as the inputs, and the inputs are a people-and-process problem before they’re a software problem.
That said, software that makes daily time entry frictionless and CO logging automatic removes most of the friction that causes late data. When field crews can post time from a phone in two taps and supervisors can log a CO the moment scope changes, the data problem largely solves itself. The report then becomes what it’s supposed to be: a decision tool, not a reconciliation exercise.
One more thing worth saying plainly: don’t compare net profit percentages across projects of very different sizes or contract types. A T&M job and a fixed-price job of the same revenue will almost never have comparable margins, and treating them as if they should produces bad decisions about which work to pursue.
Won2Build closes the data gaps that make profitability reports unreliable
The problems named throughout this guide, including missing time, untracked change orders, and slow ETL from field to finance, are exactly what Won2Build Hub is built to solve for construction subcontractors.
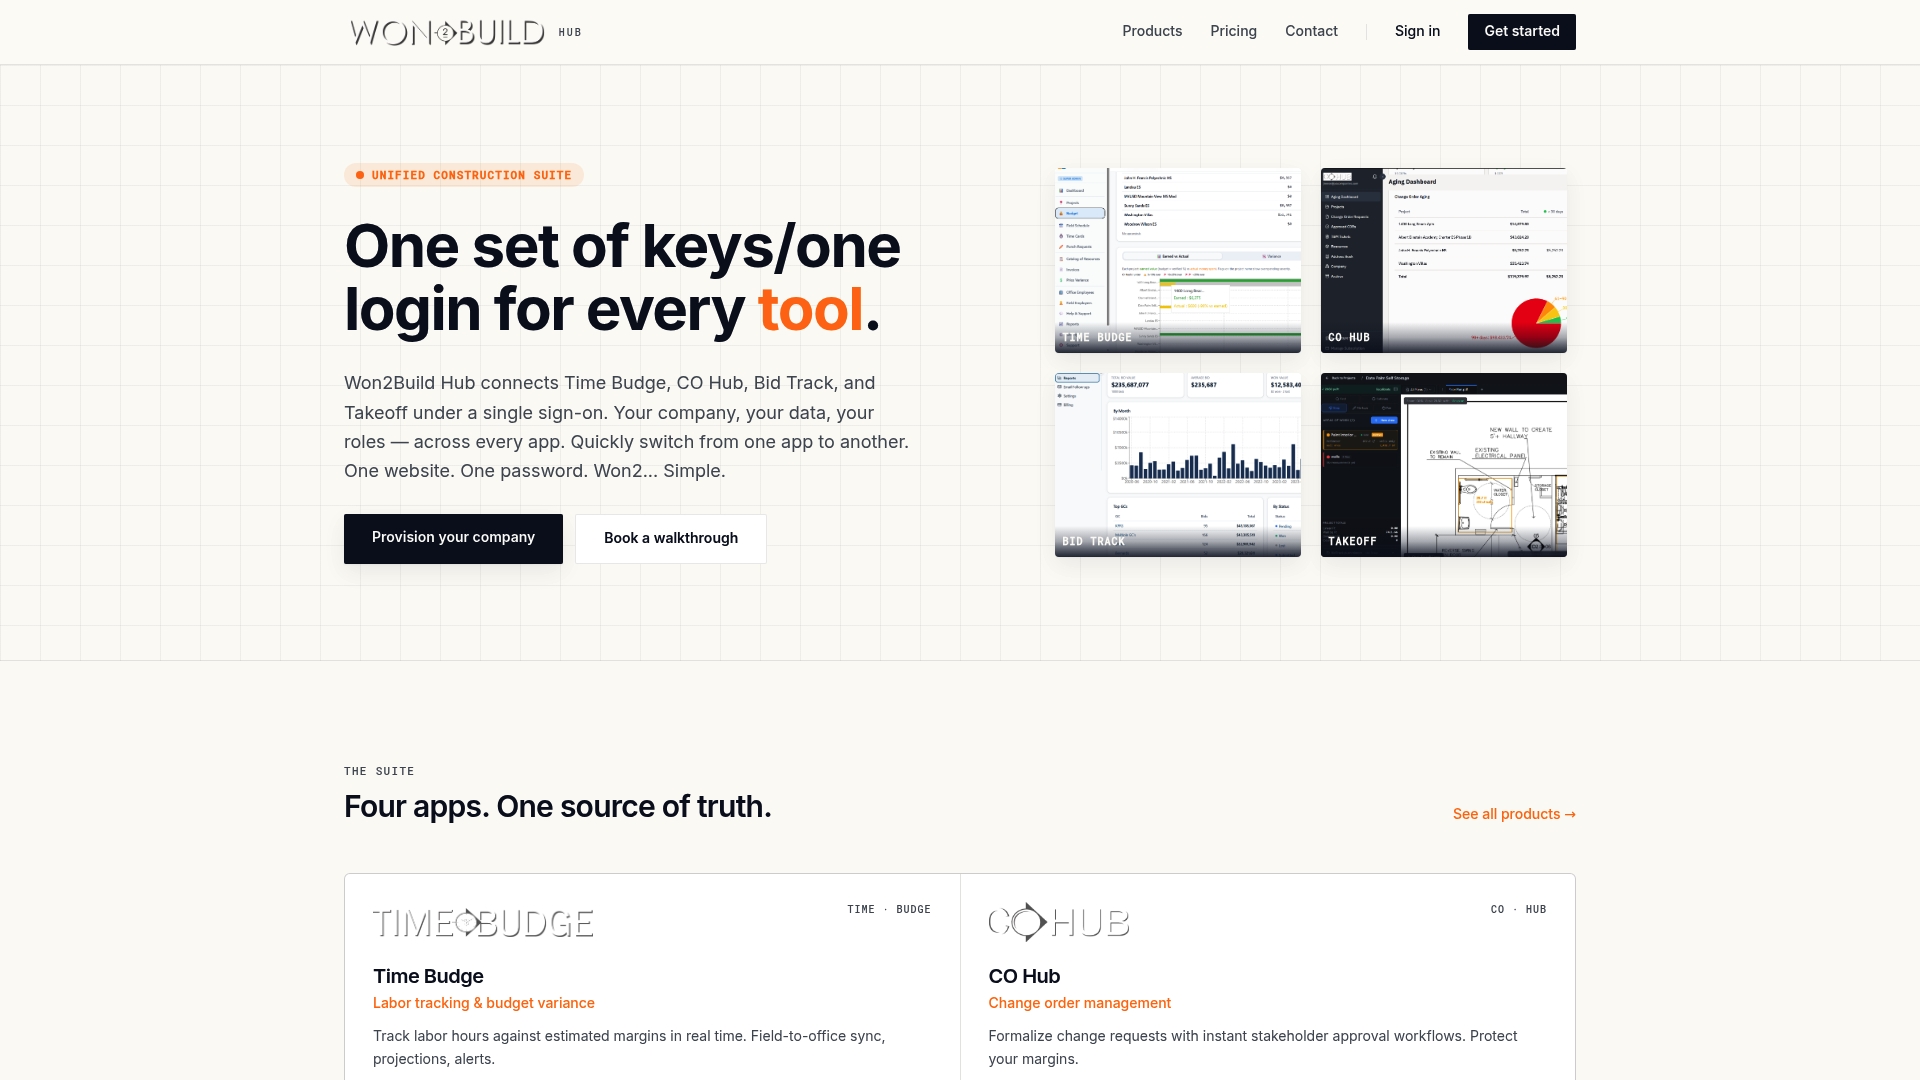
Won2Build’s integrated suite connects four modules through a single login, so data posted in the field appears in the office report without manual re-entry. Time Budge captures daily labor hours by job code from a mobile device, feeding accurate labor costs directly into the job ledger. CO Hub logs, tracks, and manages change orders from field identification through approval and invoicing, cutting the unbilled CO gap that quietly erodes margin on most jobs. Bid Track ties estimate line items to job cost codes before the project starts, making estimate-vs-actual analysis meaningful from day one. Takeoff builds the digital quantity takeoff that anchors the estimate baseline, so the number you bid is the number you measure against.
Start a free trial at Won2build and see how quickly the data gaps close.
Sources
- Abstract This study describes a comprehensive profitability analysis that introduces several novel ratios and decompositions. Key innovations relate to the separation and analysis of activities other than operating and financing, and, most importantly, to the decomposition of operating profitability.
- How to Create a Job Profitability Report
- How to Do a Profitability Analysis That Improves Your Bottom Line
Recommended
One login for estimating, bid tracking, change orders, and labor.
The Hub is free. Pay only for the apps you turn on.
Create your free Hub account- 7 Concrete Takeoff Steps Estimators Use to Avoid Ordering ShortfallsFollow seven concrete takeoff steps to calculate cubic yards, size rebar and formwork, convert volumes to supplier units, and verify quantities before bid...
- Are E-Signature Change Orders Legal and Worth the Switch?E-signature change orders streamline your workflow, ensuring faster approvals, fewer disputes, and quicker invoicing—discover the benefits now!
- How to Link Takeoff to Estimate for Accurate BidsLink your takeoff quantities to your estimate for accurate bids. Discover the seamless integration method that reduces errors and saves time.