
Estimators & PMs: 5 Inputs to Estimate Labor Hours and Close the Loop
Construction estimators and PMs: use five inputs to estimate labor hours, record why adjustments were made, and sync takeoff to field hours.

To estimate labor hours, convert your takeoff quantities into base labor hours using a documented production rate, adjust that number for site conditions, then convert the result into crew days and burdened labor cost. You need five inputs: quantity, labor hours per unit, crew size, hours per workday, and a fully burdened hourly rate. A software platform can carry takeoff quantities, time tracking, and rate libraries in one place, but the math itself works on paper just as well.
TL;DR:
- Accurate labor-hour estimates depend on detailed takeoff worksheets with documented sources, crew assumptions, and included/excluded tasks.
- Adjustments for site conditions like weather, access, or fatigue must be applied carefully, with human judgment and supervisor validation.
- Converting total adjusted hours into crew days requires feasibility checks regarding space, supervision, other trades, and site constraints.
- Fully burdened labor costs include wages, taxes, benefits, and overhead, with separate assumptions for productivity and wages to ensure accurate bid and cost analysis.
- Using integrated estimation and field tracking tools improves accuracy and closes the feedback loop between the original bid and actual job data.
Table of Contents
- How Do You Break Down Labor Hours by Task?
- Which Adjustment Factors Actually Change the Hours?
- How Do You Turn Labor Hours Into a Crew Schedule?
- How Do You Convert Labor Hours Into Burdened Cost?
- What Tools Actually Help With This Workflow?
- How Do You Close the Loop After a Job Ends?
- What the Data Actually Tells You About Estimating Labor Hours
- Get Your Labor Estimates and Field Data Working Together
- Sources
How Do You Break Down Labor Hours by Task?
Every reliable labor-hour estimate starts with a takeoff worksheet, one row per task. Skip this step and you’re guessing, no matter how good your final number looks on the bid sheet.
Each row needs five fields: task description, unit of measure, crew type and size, base labor hours per unit, and where that rate came from. A drywall hanging row might read “5/8-inch gypsum board, walls, 2-person crew, 0.018 hours per square foot, sourced from 2025 job history on the Fairview Medical project.” That last field, the source, is what turns a guess into something you can defend to a client or a superintendent six months later.
The arithmetic is simple once the row is built. Quantity times hours-per-unit equals base labor hours. If you have 4,200 square feet of board at 0.018 hours per unit, that’s 75.6 base labor hours before any adjustment. Some rows come in output-per-hour instead, like “60 linear feet of conduit per hour.” Just flip the math: quantity divided by output-per-hour gives you the same base labor hours.
Where do these rates come from? Four places, roughly in order of reliability:
- Your own company’s job-cost history, pulled from timecards on comparable work
- Trade association manuals and licensed cost databases like RSMeans
- Direct foreman or superintendent input on tasks with no clean historical match
- Manufacturer installation guides, which tend to run optimistic and need a discount
Before you move to adjustments, document four things on every row: source, crew assumption, what’s included and excluded (does that drywall rate include taping?) and the date you last reviewed the number. A rate library nobody updates is worse than no rate library, because it looks authoritative while being wrong.
Which Adjustment Factors Actually Change the Hours?
Base labor hours assume ideal conditions, which almost never exist on a real job site. This is where most estimates quietly go wrong, either by ignoring adjustments entirely or by stacking too many of them on the same task.
The standard factor screens cover a short list: weather exposure, restricted site access, overtime and fatigue degradation on extended shifts, night work, confined spaces, and elevated or awkward-position work. Each one gets a multiplier, and multipliers compound rather than add.
Here’s a short sequence for applying them without double-counting:
- List every condition that plausibly applies to the task, not just the obvious ones.
- Check whether two factors are describing the same root cause (confined space and elevated work often overlap on mechanical rooms) and pick the stronger one.
- Multiply the surviving factors against base hours, one at a time.
- Route anything you can’t quantify with confidence into a contingency band, typically 10 to 20%, instead of forcing it into a factor.
Calculators will show you the arithmetic, but as ToolGrit’s man-hour estimating guide points out, nothing in the tool tells you which factors apply or how strong they should be. That judgment call belongs to a human.
Pro Tip: Have your superintendent or lead foreman initial the adjustment sheet before the bid goes out. A second set of field eyes catches overlapping factors and missing ones far more often than a desk review does.
How Do You Turn Labor Hours Into a Crew Schedule?
Adjusted labor hours only matter once you know how many working days they represent. The formula is straightforward: total adjusted hours divided by crew size divided by hours per workday equals crew days.
Take 94 adjusted labor hours on a 3-person crew working 8-hour days. That’s 94 divided by 3, divided by 8, which comes out to roughly 3.9 days. Round up, and you’re planning for four calendar days of work.
That number is a floor, not a guarantee, so run it through a few feasibility checks before it goes on a schedule:
- Does the space actually support a 3-person crew, or will staging and material stacking cut effective output?
- Is there enough supervision to keep that crew accountable, especially on a task with quality risk?
- Are other trades stacked in the same area during the same window, competing for the same square footage?
- What supervisory ratio does this crew size require, and do you have it on-site that week?
The simple conversion also leaves out holidays, inspection windows, and material lead times that stall a crew mid-task. Flag those separately rather than burying them in the hours number. Once the crew days are confirmed feasible, hand them to whoever builds the CPM schedule with the task dependencies noted, not just a start date and a duration.
How Do You Convert Labor Hours Into Burdened Cost?
Labor hours only tell half the story until you attach a dollar figure to them, and that dollar figure needs to reflect the true cost of putting a worker on-site, not just their base wage.
A fully burdened hourly rate includes base wage, payroll taxes, workers’ compensation, benefits, and any per diem or travel pay. IRS Publication 15 lays out employer payroll tax responsibilities in detail, and IRS Topic 759 covers the wage definitions that feed into that burden calculation. Skip either category and your “labor cost” is really just a wage estimate wearing a cost estimate’s clothes.
The cost formula itself is simple: labor hours times fully burdened hourly rate equals labor cost per task. On that drywall example, 98 adjusted hours at a $52 burdened rate comes to $5,096, before overhead and profit markup get layered on separately.
Keep two sets of assumptions apart at all times:
- Productivity assumptions — units per hour, crew size, condition factors
- Wage assumptions — base pay, burden rate, benefit load
Blend the two and you lose the ability to diagnose a bad bid after the fact. Was the crew slower than planned, or did wages run higher than budgeted? Different problems, different fixes.
Run three quick spot checks before finalizing: does the crew size in your labor-hours math match the crew size in your cost math, does the burdened rate reflect current payroll costs rather than last year’s, and does the total labor cost per unit look reasonable against published BLS employment cost data for the trade.
What Tools Actually Help With This Workflow?
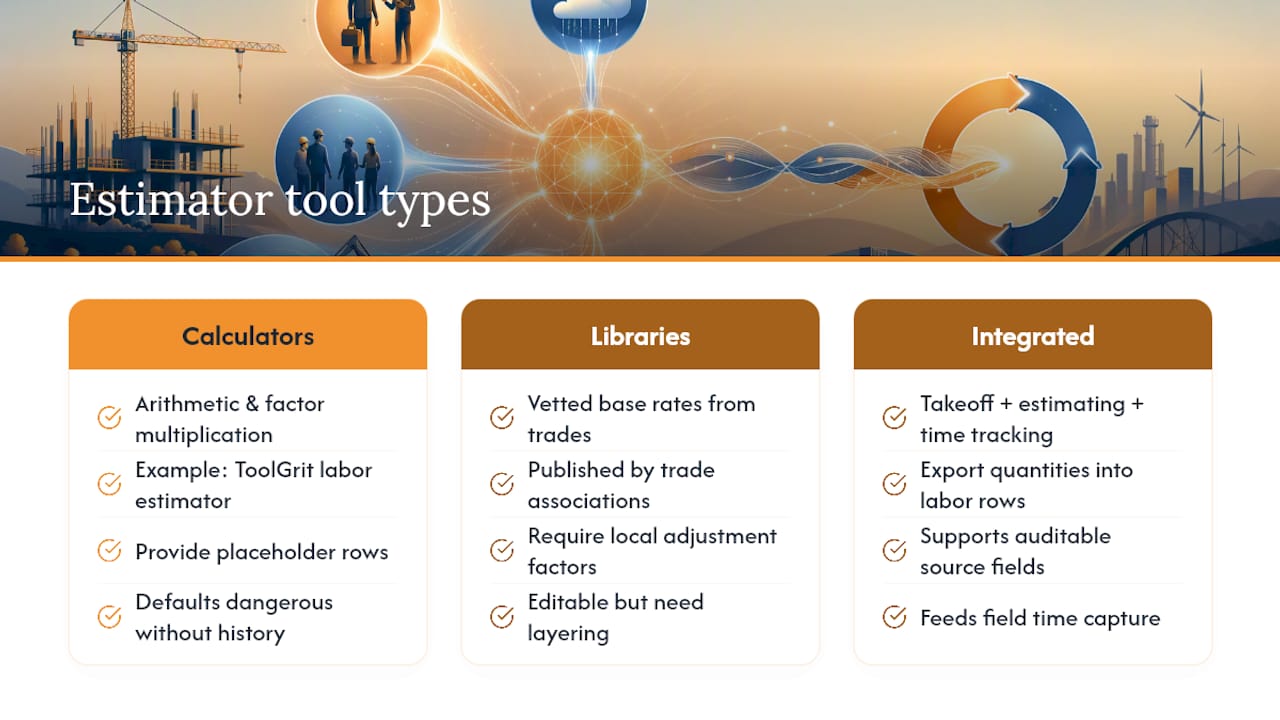
Three categories of tools show up in most estimators’ workflow, and knowing which one you’re using, and its limits, matters more than which brand you pick.
Free online calculators handle the arithmetic and factor multiplication but ship with placeholder rows. ToolGrit’s labor estimator is a decent example: useful for sanity-checking a number, dangerous if you bid off its default rates without swapping in your own history. Licensed productivity libraries, the kind published by trade associations, give you vetted base rates but still need your local adjustment factors layered on top. Integrated platforms combine takeoff, estimating, and time tracking under one login, which matters more than it sounds like it should.
Whatever you use, require four features: editable labor-unit rows (not locked presets), factor screens you can document, auditable source fields on every rate, and a feedback loop back to actual field hours.
Some integrated platforms export quantities directly into labor-hour rows, which then feed field time capture modules, closing the loop between what you bid and what actually happened without re-keying data twice.
Pro Tip: Never accept a calculator’s default productivity rate for a bid without checking it against at least one comparable job from your own history. Presets are built for national averages, not your crew, your region, or your equipment.
How Do You Close the Loop After a Job Ends?
The estimate you submit is a hypothesis. The job that actually gets built is the data that proves or disproves it, and most estimating teams throw that data away by never capturing it in a usable form.

Feed that back into the rate row you started with, updating the base hours-per-unit figure and noting the source as “job actual” alongside the date.
Reliable Plant’s estimating guidance notes that estimators with hands-on technician backgrounds, and foremen who weigh in during the estimate rather than after, consistently produce tighter numbers. On the analytical end, ASCE research on neural-network production models shows machine learning can predict efficiency multipliers for repetitive industrial tasks, a useful reference if you’re estimating high-volume, low-variety work.
The gap between a bid and a job cost report is where every estimating team’s real education happens. If that gap never gets reviewed, the same errors just repeat at a bigger scale next year.
Certain software solutions sync field time entries back to the office in real time, which shortens this reconciliation cycle from weeks to days and cuts the double entry that usually causes teams to skip it altogether.
What the Data Actually Tells You About Estimating Labor Hours
Most advice on estimating labor hours treats the productivity rate as the hard part. It isn’t. The rate you pull from a manual or your own job history is a starting number anyone can look up. The part that separates a defensible estimate from a lucky guess is the documentation trail behind every adjustment you make to that number, and almost nobody keeps one.
I’d argue the conventional wisdom gets the emphasis backwards. Estimators spend hours debating whether a production rate should be 0.015 or 0.018 hours per unit, then apply a weather factor with no note on why they chose 1.1 instead of 1.15, and no name attached to who made that call. Six months later, when the job runs over, nobody can reconstruct the reasoning.
If you take one thing from this guide, make it this: build the habit of writing down why before you write down how much. The rate matters less than the paper trail that lets you find out you were wrong, and by how much, and fix it for the next bid. That’s the entire value of a rate library that updates itself from field data instead of sitting static in a spreadsheet nobody opens after the bid goes out.
— Jen Reese
Get Your Labor Estimates and Field Data Working Together
Most estimating tools stop at the bid. Some software platforms connect estimated labor hours to the hours crews actually log, so the two numbers talk to each other instead of living in separate spreadsheets that never get reconciled.
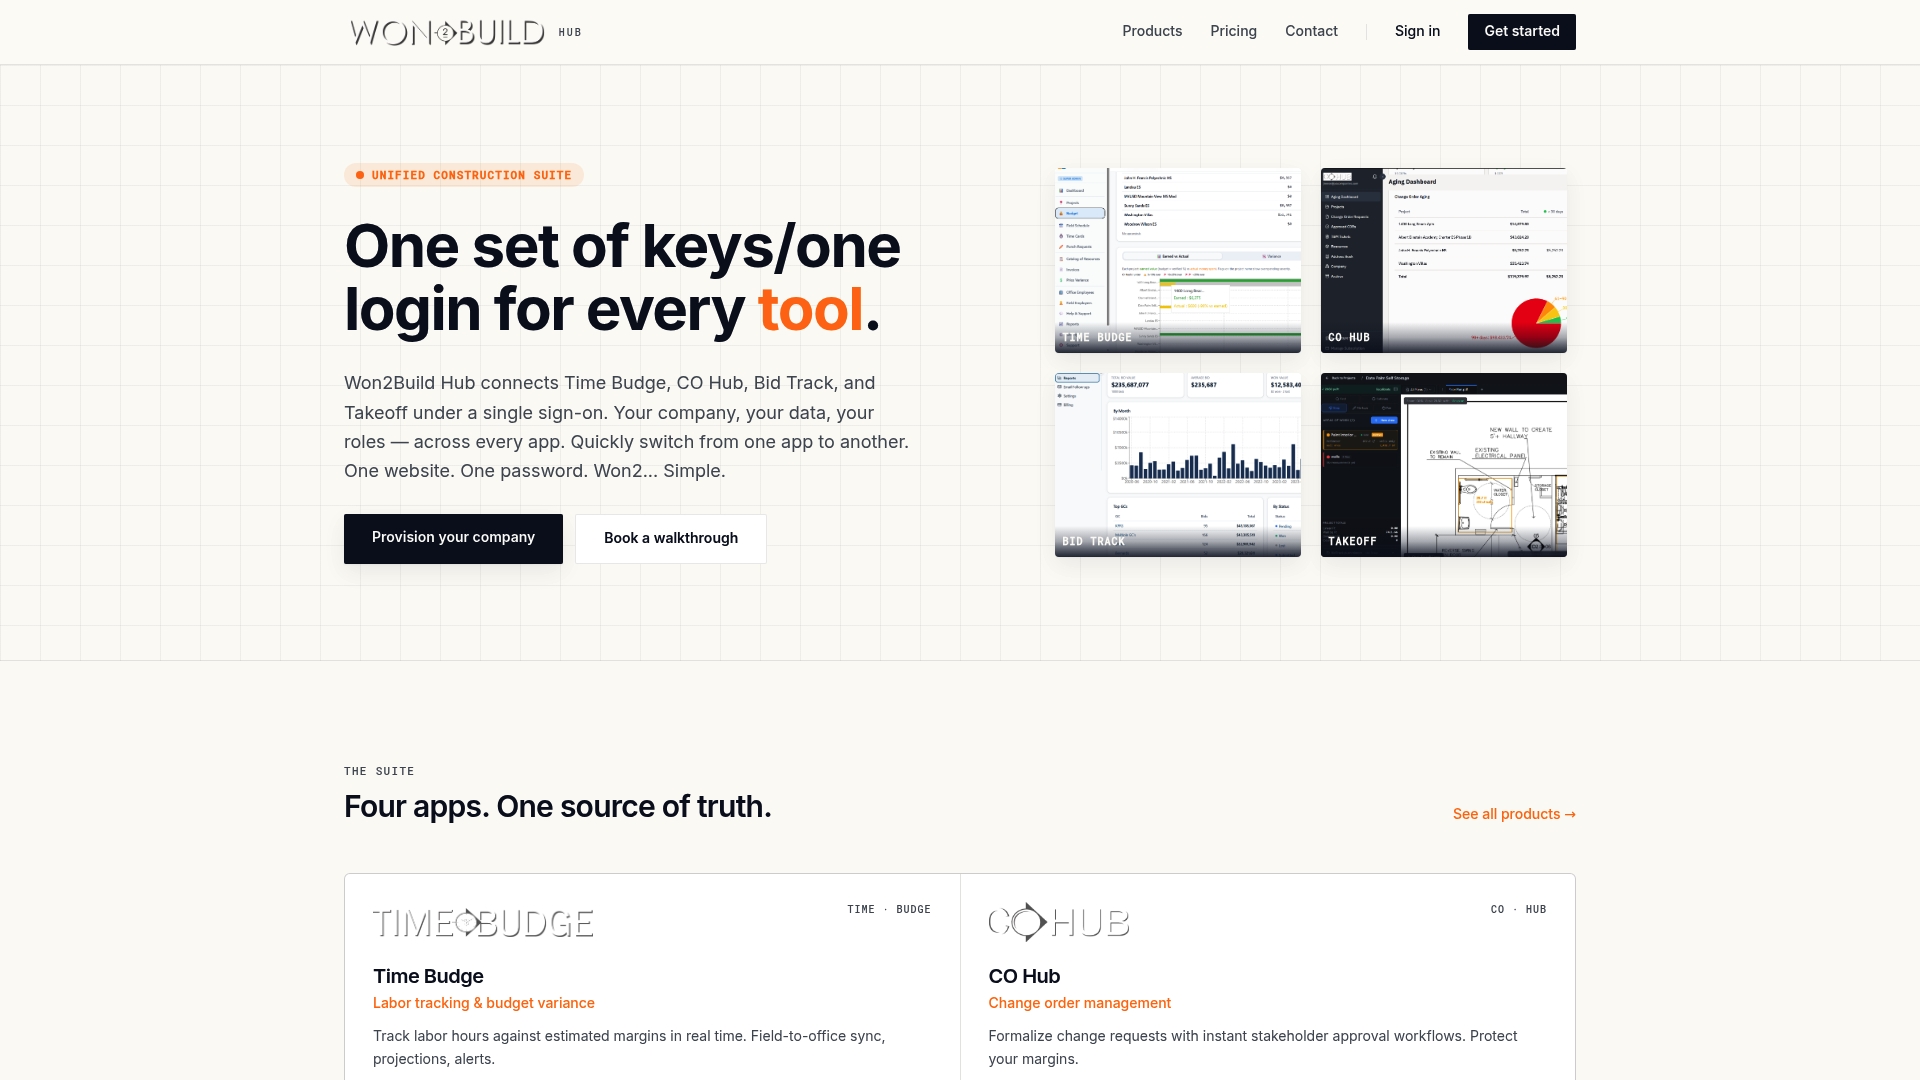
This integration is important for subcontractors juggling takeoff, bidding, and field time tracking across multiple active jobs, where a single login replaces multiple disconnected logins and the re-keying that comes with them. The Takeoff module pulls quantities straight off digital plans and pushes them into your labor-hour rows, so the worksheet you build in this guide doesn’t have to be rebuilt by hand every time. Pair that with Time Budge field tracking and you get the actual-hours feedback loop that turns a static rate library into one that improves with every closed-out job. If overhead allocation is your next question, Anodos’s breakdown of indirect construction costs covers the piece that sits just outside labor math.
Consider using a software platform with integrated takeoff and bidding features before building your next bid worksheet by hand.
Sources
- BLS news release (Employment and productivity data)
- IRS Publication 15 (Employer’s Tax Guide)
- ASCE paper on neural-network approach to estimating labor production rates
- ToolGrit: construction man-hour estimating guide
Recommended
One login for estimating, bid tracking, change orders, and labor.
The Hub is free. Pay only for the apps you turn on.
Create your free Hub account- Managers: Make Mobile Field Workflows Resilient for 72 Hour OutagesPlaybook for field managers: offline first mobile workflows, resilient sync and conflict handling, compliance first AI guardrails, and practical pilot steps.
- Daily Signed Records: Force Account Tracking for Managers & InspectorsField checklist for project managers and inspectors to keep force account tracking audit-ready: use daily signed records for labor, equipment, and...
- Stop Timecard to Report Drift: Labor Cost Codes for SubcontractorsFix the timecard to report chain with labor cost codes that tie crews to budgets. Includes a 6 code starter and a burdened rate example.