
Construction Estimate Accuracy: AACE Ranges, QRA, and EVM Checks
See how AACE estimate classes set cost accuracy ranges, then apply QRA, EVM thresholds, and field checks to tighten construction estimates in practice.

Estimating accuracy in construction measures how closely a projected cost matches the final, actual cost of a project. The industry’s working benchmark comes from AACE’s cost estimate classification system, which ties expected accuracy to how much design and scope information exists at the time of the estimate. Those ranges describe uncertainty, not a promise, and every estimator should present them that way.
TL;DR:
- Class 5 ranges span 20% to 30% below and 30% to 50% above cost; Class 1 narrows to 3% to 10% below and 3% to 15% above.
- Treat AACE bands as uncertainty ranges, not promises; unusual complexity or weak project controls can drive errors beyond published limits, so use quantitative risk analysis.
- A 2020 study of 95 projects found client estimates averaged 16% below final cost, while contractor estimates averaged 2% above, reflecting different biases.
- Before pricing, review work packages and methods, verify quantities against current project specific costs, document assumptions, and reclassify estimates as design develops.
- A study comparing 30 methods found most earned value forecasts became reliable only after projects reached 50% to 80% completion, so treat early outputs as directional.
Table of Contents
- Estimate accuracy ranges and AACE estimate classes
- Primary factors that cause estimates to deviate
- Actionable best practices to improve accuracy
- When EVM and EAC forecasting become reliable
- Tools and data practices that produce measurable accuracy gains
- Where estimators should focus for immediate impact
- How Won2Build Hub keeps estimating data consistent
- FAQ
- Sources
Estimate accuracy ranges and AACE estimate classes
AACE’s 56R-08 classification system sorts estimates into five classes based on how much project definition exists when the number gets produced. Class 5 estimates get built from almost nothing, maybe a program statement or a rough capacity figure, while Class 1 estimates get built from near-complete design documents ready for bid.
- Class 5: minimal design input, used for screening or concept studies.
- Class 4: basic scope defined, used for feasibility and early budget approval.
- Class 3: project scope defined enough for budget authorization or control.
- Class 2: detailed design substantially complete, used for bid and control estimates.
- Class 1: full design and specifications, used for final checks and bid tabs.
Class 5 estimates typically carry a range of -20% to -30% on the low end and +30% to +50% on the high end, while Class 1 estimates tighten to roughly -3% to -10% low and +3% to +15% high. That is a useful benchmark for working estimators, since it sets expectations before line items get priced.
These bands are ranges-of-ranges, a starting point rather than a guarantee. AACE’s own guidance notes that projects with unusual technical complexity or weak project control systems can see high-end errors run substantially larger than the published figures. Translating a class into a defensible number for a specific job requires Quantitative Risk Analysis (QRA), which separates identified risks from the general uncertainty baked into the classification itself.

Primary factors that cause estimates to deviate
Cost overruns rarely trace back to a single bad input. Research cataloging construction cost and schedule variance points to a recurring set of drivers that show up project after project.
- Poor planning and site management, which delays decisions and compounds small errors.
- Labor shortages and productivity shortfalls, especially on schedules built with optimistic crew output.
- Supply chain and procurement failures, including material lead times that outlast the original schedule.
- Design changes and scope creep introduced after pricing is locked.
- Coordination failures between trades, design teams, and owners.
- Other project-specific disruptions, which can be harder to quantify but may still shift final cost.
A 2020 study of 95 projects published by ASCEME.1943-5479.0000772) found a systematic split in how each side of a contract misjudges cost: client-side estimates averaged a 16% underrun, while contractor-side estimates averaged a 2% overrun. That gap reflects optimism bias on one side and pessimism bias on the other, and it is worth naming explicitly when reconciling an owner’s budget against a bid.
As a rule of thumb, scope gaps and design changes tend to push the high end of the range (the upside risk), while aggressive productivity assumptions and underpriced labor tend to erode the low end.
Pro Tip: Track which risk category caused each overrun on past projects; a simple tally by driver turns anecdote into a contingency model you can defend.
Actionable best practices to improve accuracy
Accuracy improves through process discipline more than through faster math. A few steps, applied in sequence, close most of the gap between a rough number and a defensible one.
Start with a detailed documentation review, ideally using Installation Work Packages (IWPs) or an equivalent breakdown, before pricing anything. Reviewing IWPs forces an estimator to think through means, methods, equipment, and labor sequencing before committing to a number, which tends to catch gaps that a straight quantity takeoff misses.
- Perform a detailed QTO and cross-check unit costs against a current, project-specific database rather than a generic catalog.
- Run a Quantitative Risk Analysis to size contingency, keeping identified risks separate from the general uncertainty allowance.
- Layer quality-control reviews so a second estimator checks assumptions, not just arithmetic.
- Document every assumption in writing so it can be revisited as design information improves.
- Reclassify the estimate (move it from Class 4 to Class 3, for example) as scope matures, rather than refining the old number in place.
A line-item example makes the point concrete: a partner guide on pool renovation costs breaks a single scope into itemized ranges rather than one lump figure, which is the same discipline that separates a defensible Class 2 estimate from a guess dressed up with decimals.
CMAA guidance frames this well: accuracy comes from collaborative, multi-layered review that challenges assumptions across disciplines, not from calculating faster. Our own post on building job cost estimates that protect margins covers how this review structure plays out on a live bid.
Pro Tip: Set a standing review gate at each design milestone so the estimate gets re-run, not just re-read, every time the drawings change.
When EVM and EAC forecasting become reliable
Earned Value Management (EVM) gives project teams a way to forecast final cost (the Estimate at Completion, or EAC) while a job is still underway, but the forecast is only as good as the amount of real progress behind it. An MDPI study comparing 30 deterministic EAC methods found that most reach stable, reliable accuracy only after roughly 50% to 80% of a project is complete. Before that window, there simply isn’t enough actual cost and schedule performance data for the formulas to converge.
- Treat EAC output from the early stages of a project as directional, not final.
- Prefer simpler, well-tested deterministic formulas; the MDPI comparison found several basic methods outperformed more complex ones on both stability and accuracy.
- Use EVM variance trends (cost performance index, schedule performance index) to decide when to revisit contingency, not just to report status.
Once a project reaches the 50% to 80% stage, EAC updates become a legitimate input for tightening contingency and adjusting the reporting cadence to stakeholders, since the underlying data has enough history to support the trend.
Tools and data practices that produce measurable accuracy gains
Most accuracy loss on a live job comes from mismatched assumptions between the people who estimated it and the people building it, not from bad math. An integrated workflow that connects takeoff, bid tracking, change orders, and field labor data keeps the quantities and unit costs from drifting apart as a project moves from bid to execution. Our piece on integrated estimating and cost predictability covers how that connection plays out for project managers specifically.
- Keep a single source of truth for current drawings so field and office teams never price against different versions.
- Timestamp cost sources so stale unit prices get flagged before they’re reused.
- Maintain version control on estimates so a Class 3 budget and a Class 2 refinement are never confused with each other.
- Sync field data back to the estimate so actual productivity updates the assumptions behind future bids.
Software speeds up the mechanical parts of this work: measuring, pricing, and tracking changes. The accuracy ceiling still depends on the quality of the inputs and the discipline of the review layered on top, which is why our guide to why accurate takeoffs matter treats takeoff precision as a prerequisite, not a feature.
Where estimators should focus for immediate impact
If I had to pick one lever, it would be scope clarity over unit-cost precision. An estimator who understands the means and methods behind a line item catches errors that no database lookup will. Pair that with QRA-based ranges instead of single-point numbers, and with operational habits like version control, milestone review gates, and field-to-office sync. None of that requires new software first; it requires treating the estimate as a living document.
— Jen Reese
How Won2Build Hub keeps estimating data consistent
Most accuracy problems we see trace back to the same root cause: a quantity or assumption gets re-typed somewhere between takeoff, bid, and the field, and the version that survives isn’t the right one. Won2Build Hub connects Bid Track and Takeoff for estimate and quantity control with Time Budge and CO Hub for field-driven cost updates, through a shared login, so the numbers behind a bid stay tied to what crews actually report back.
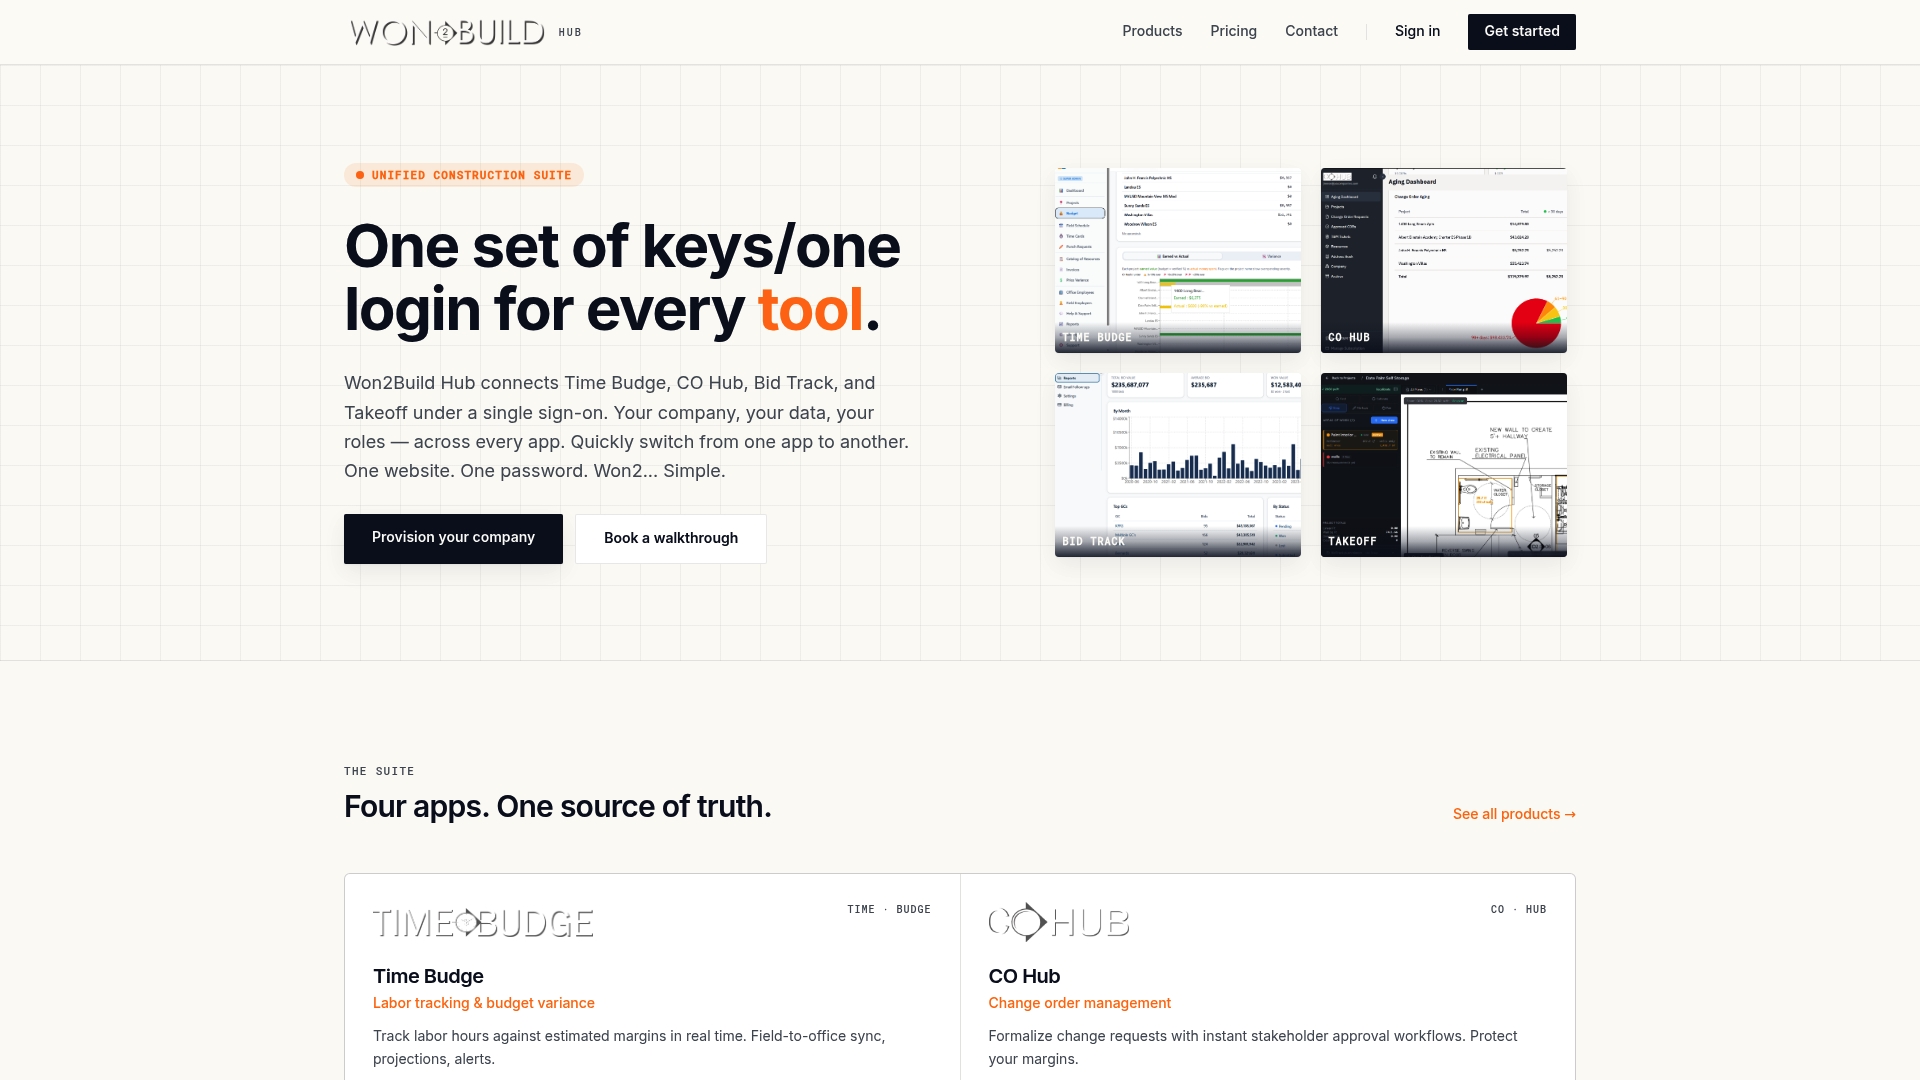
If scope drift and re-entry errors are eating into your margins, check pricing and plan details or look at Bid Track directly to see how an integrated estimate workflow fits your current process.
FAQ
What is the most accurate estimating technique?
No single technique is universally most accurate; accuracy depends on matching the method to available design detail. Detailed takeoff against complete design documents, the basis of AACE Class 1 and Class 2 estimates, produces the tightest ranges because it relies on the most project-specific information.
What is the 0.6 rule for cost estimating?
A capacity-based cost-scaling rule is a parametric method for estimating a new facility’s cost from the cost and capacity of a similar facility. It is a rough-order-of-magnitude technique suited to early, low-definition estimates rather than bid-level pricing.
How accurate are construction estimates?
Accuracy depends entirely on how much design information exists when the estimate is produced. Early-stage Class 5 estimates typically run -20% to -30% low and +30% to +50% high, while near-final Class 1 estimates tighten to roughly -3% to -10% low and +3% to +15% high.
Can ChatGPT do construction estimates?
General-purpose AI tools can help draft scope descriptions or summarize specifications, but they cannot perform a reliable takeoff or price work without project-specific drawings, current unit costs, and local market data. Treating an unverified AI output as a bid-ready estimate skips the quantity verification and risk analysis that accuracy actually depends on.
How is estimating accuracy measured after a project finishes?
Estimating accuracy is typically measured by comparing the final actual cost to the original estimate, often expressed as a percentage variance or as mean absolute percentage error across multiple projects. Tracking this by estimate class and by project type over time shows whether an organization’s ranges match the AACE benchmarks or need adjustment.
Sources
The method behind an estimate tends to track the class it belongs to. Parametric and rough-order-of-magnitude (ROM) approaches, which scale cost from a handful of variables like square footage or capacity, fit Class 5 and Class 4 work because they don’t require detailed drawings. Unit-rate and assembly-based estimating sits in the middle, pricing recognizable systems (a linear foot of wall, a ton of HVAC capacity) once a schematic design exists. Detailed takeoff, where every quantity gets measured and priced individually, belongs to Class 2 and Class 1 work and demands a largely complete design package.
- 56R-08: Cost Estimate Classification System – As Applied in Engineering, Procurement, and Construction for the Building and General Construction Industries
- Mdpi
Accuracy within any of these methods depends heavily on data quality rather than the method label alone. Cost-data recency matters: unit prices pulled from an older job bid can be stale once material and labor markets shift. Regional adjustment matters just as much, since a unit cost from one metro area rarely transfers cleanly to another. Quantity takeoff (QTO) precision is the other lever, and our field guide to estimate components walks through the line items that most often get missed.
Software can standardize how fast these calculations happen, but it cannot correct a poorly defined scope. A detailed takeoff built against incomplete drawings still produces an estimate with Class 4 uncertainty dressed up in Class 2 formatting.
Recommended
One login for estimating, bid tracking, change orders, and labor.
The Hub is free. Pay only for the apps you turn on.
Create your free Hub account- Bid Pipeline Management: 7 Stages That Protect Subcontractor MarginsSee how subcontractors can track bids with CRM fields, a scorecard, weekly and monthly cadences, and a process with seven stages built to protect margins.
- Subcontractor Project Reports: 3 Templates for Same Day ProofCopy three daily report templates to log crew hours, work, materials, safety, and GC directives, creating records with timestamps that support pay.
- Change Order Pricing: Daily T&M Tickets Protect Subcontractor MarginLearn to price change orders with defined scope, cost codes, signed daily T&M tickets, and contract exhibits that support subcontractor payment.